2026 wildfire Jackson County, Oregon
Woodrat Mountain
A fast perimeter the night it was reported, a return eight nights later, and a last look that found almost nothing, until the pilot walked it.
- Nights of maps
- 3
- August 6 to August 19
- Map sets delivered
- 4
- Flown by Rogue Reconnaissance, the founder's company
- Heat sources on the busiest map
- 399
- Whole fire, night of August 6
- Acres on the incident record
- 282
- Read September 13, 2026
A perimeter for the first night
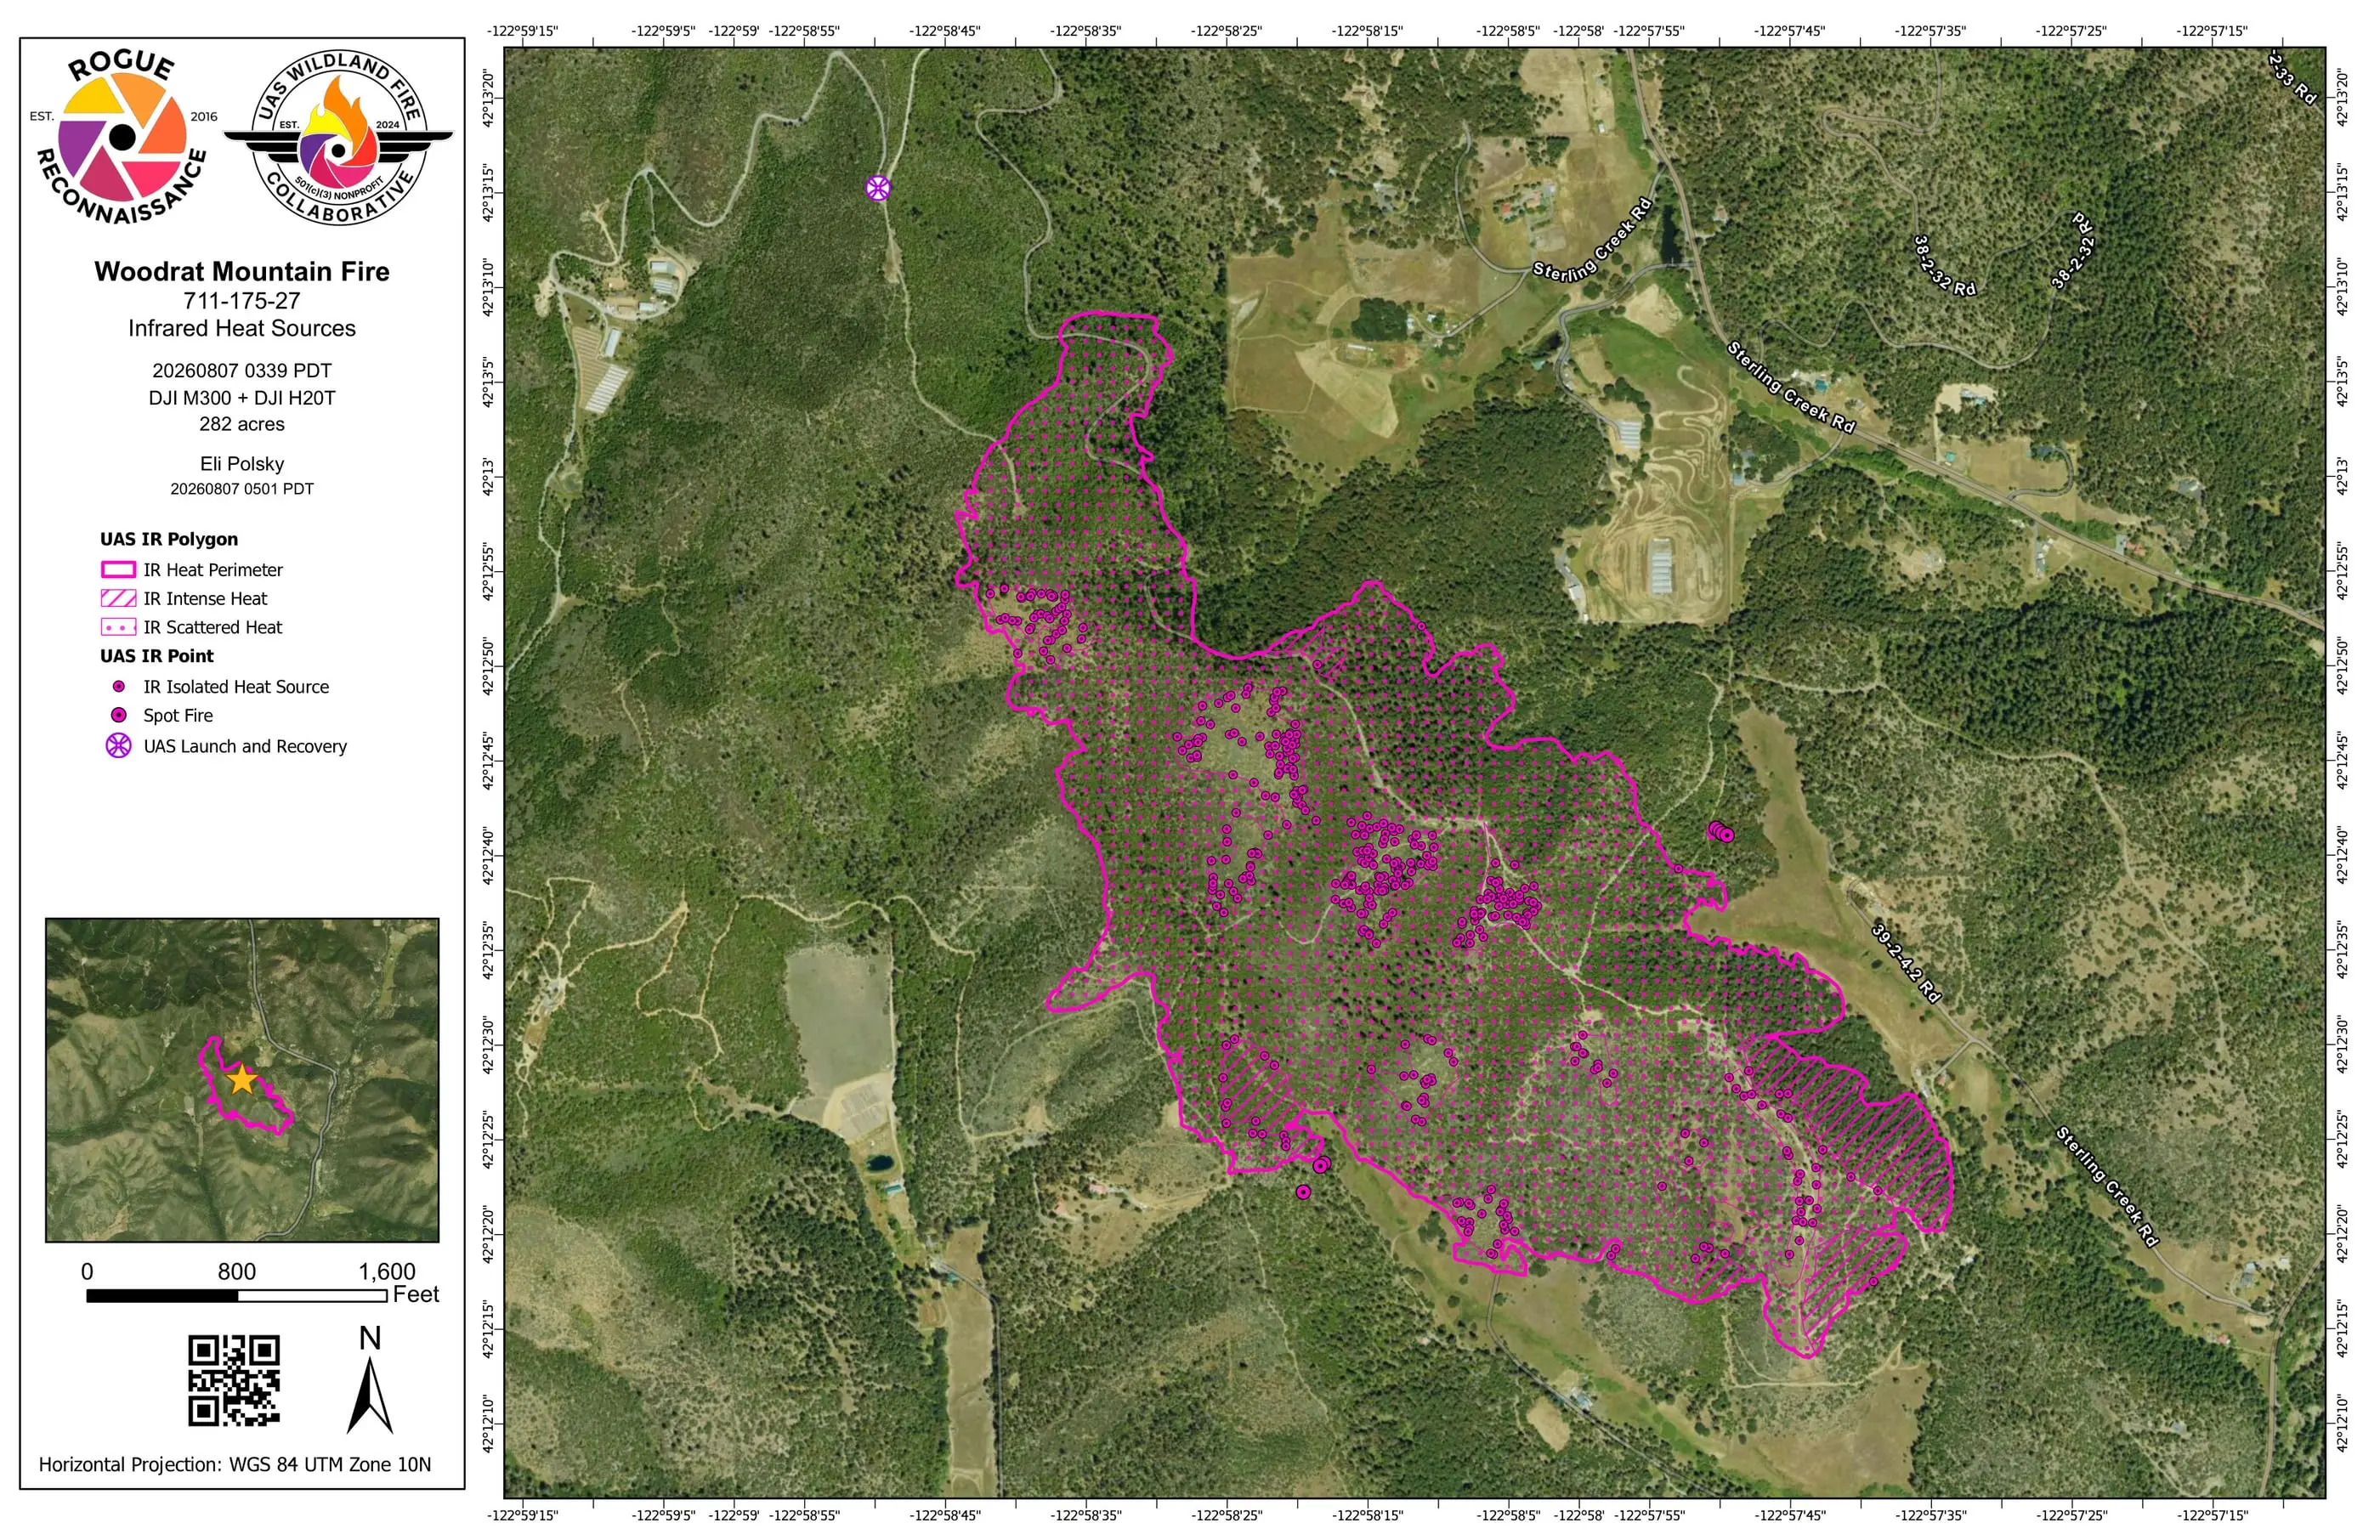
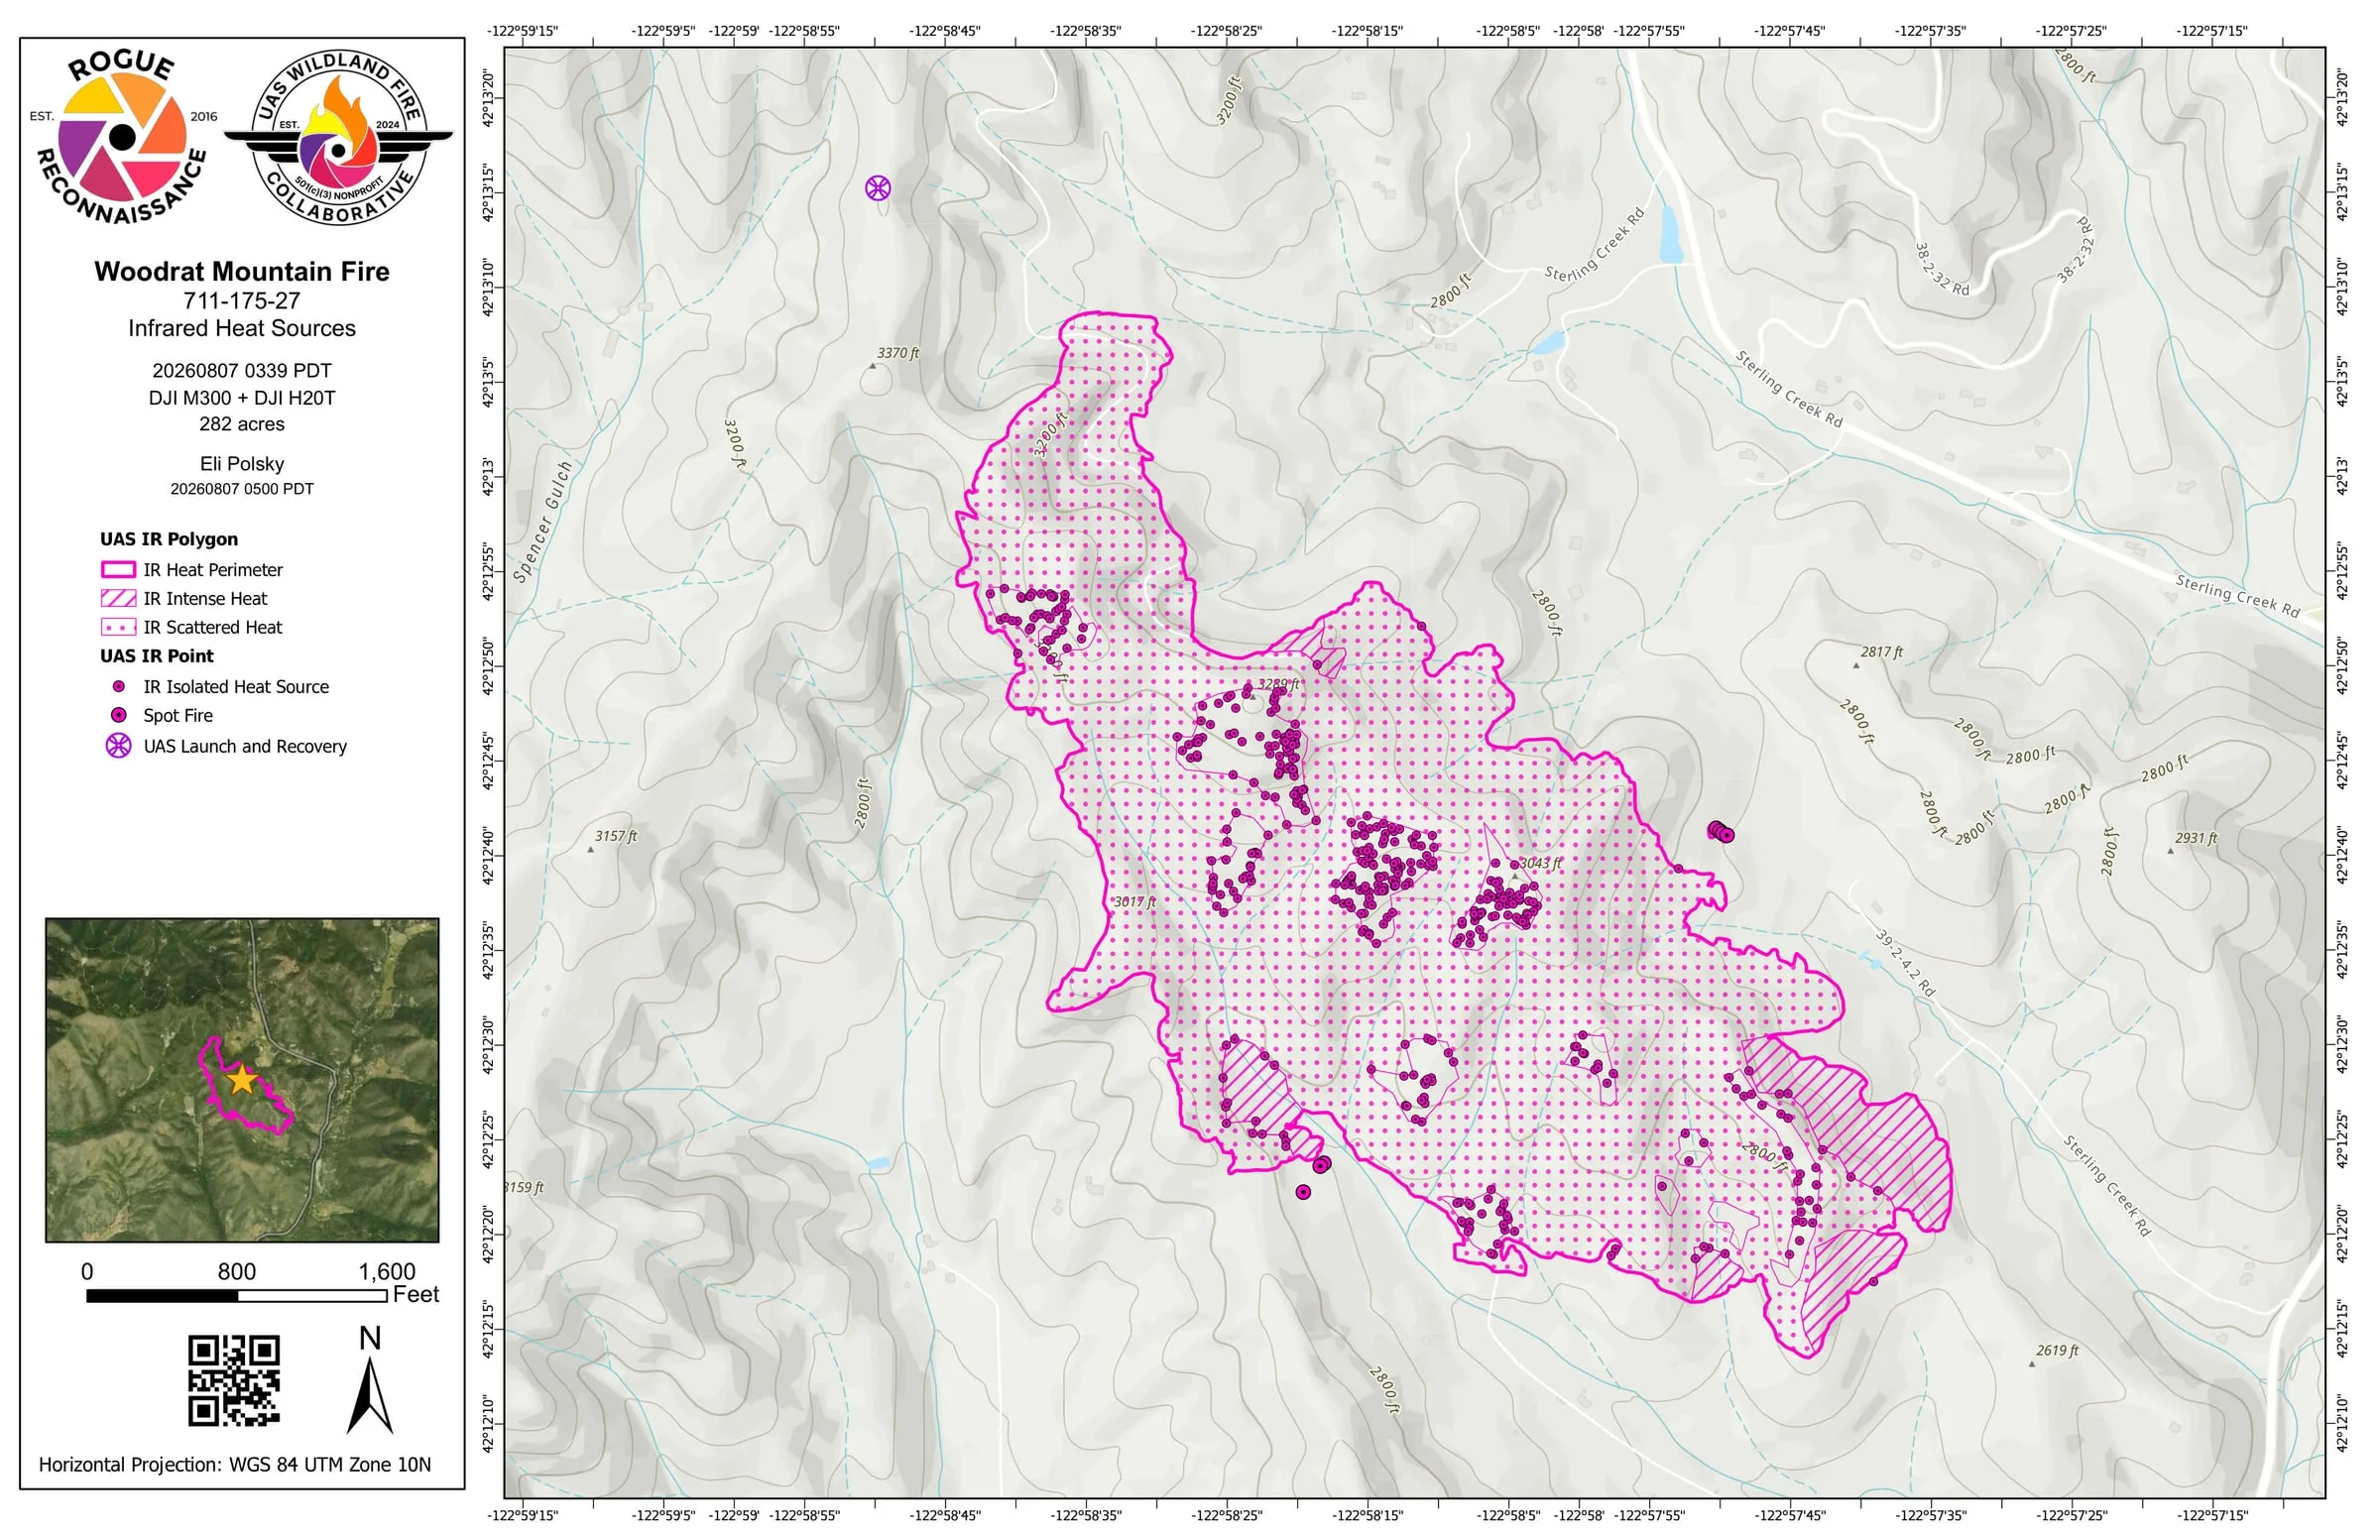
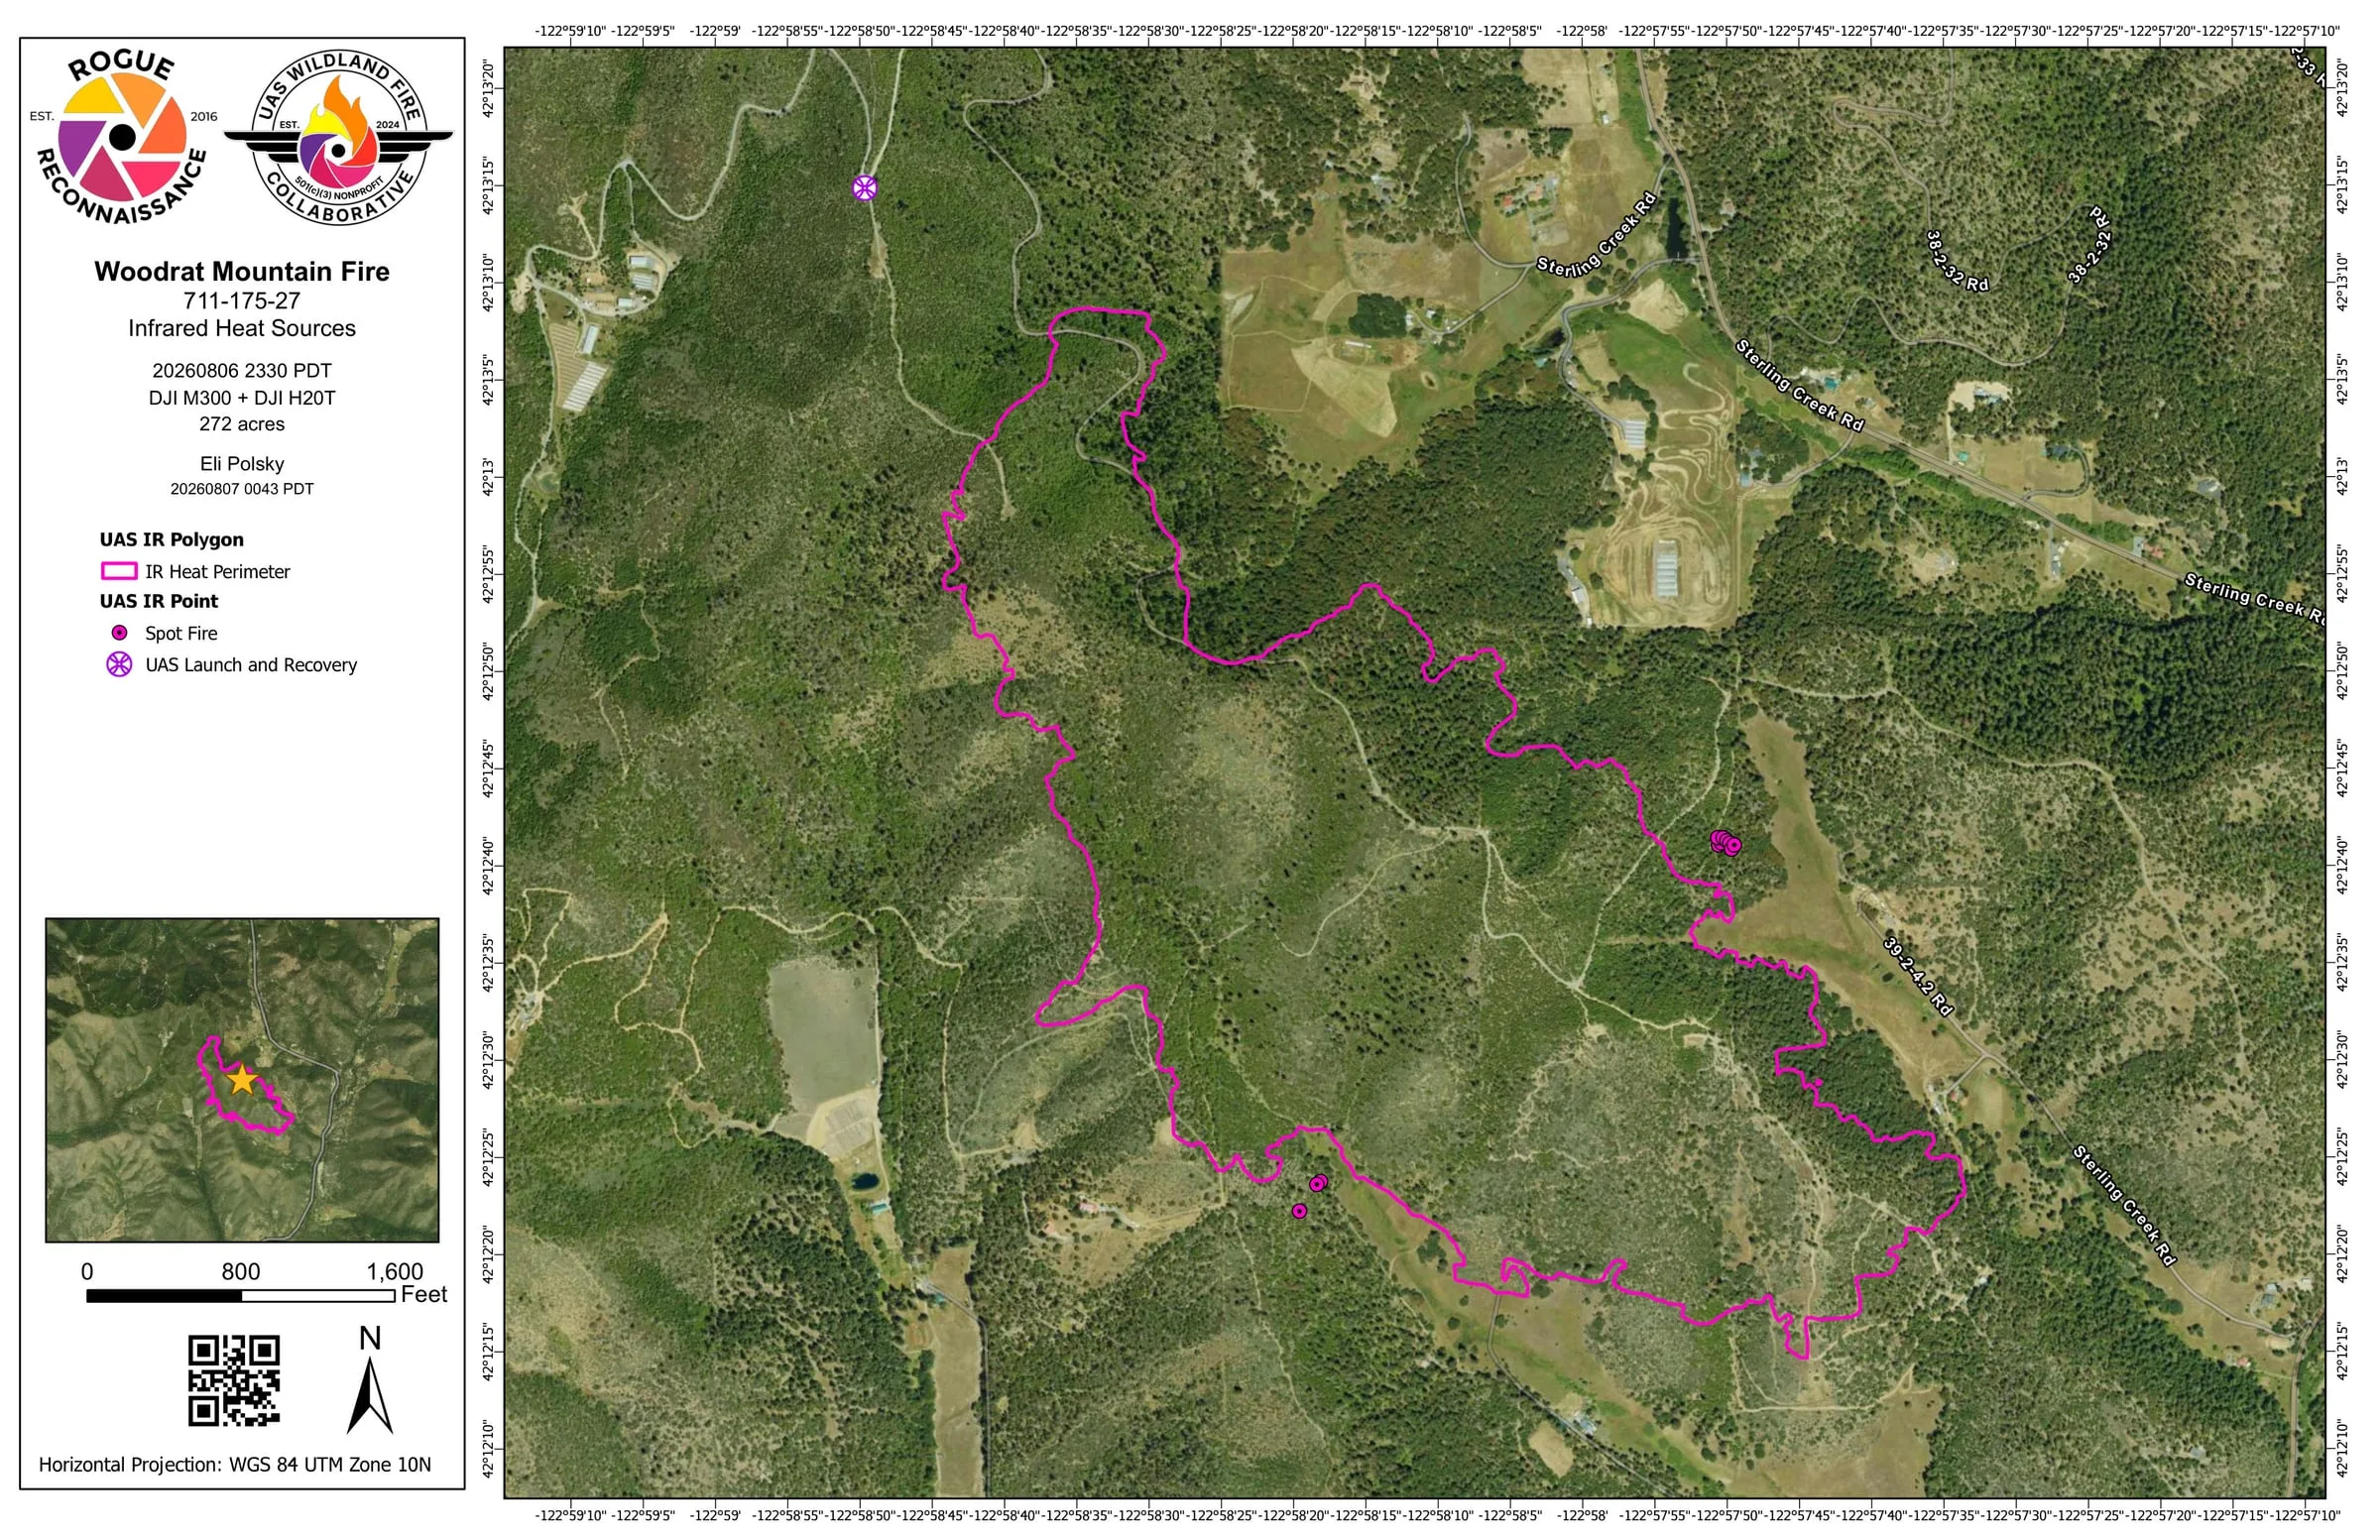
Woodrat Mountain was reported around midday on August 6 in Jackson County. At 11:30 that night the first flight went up for a fast perimeter, delivered for night operations as it processed. The whole fire followed at 3:39 in the morning, interior and all, for the morning briefing. Both maps that night marked spot fires.
Coming back
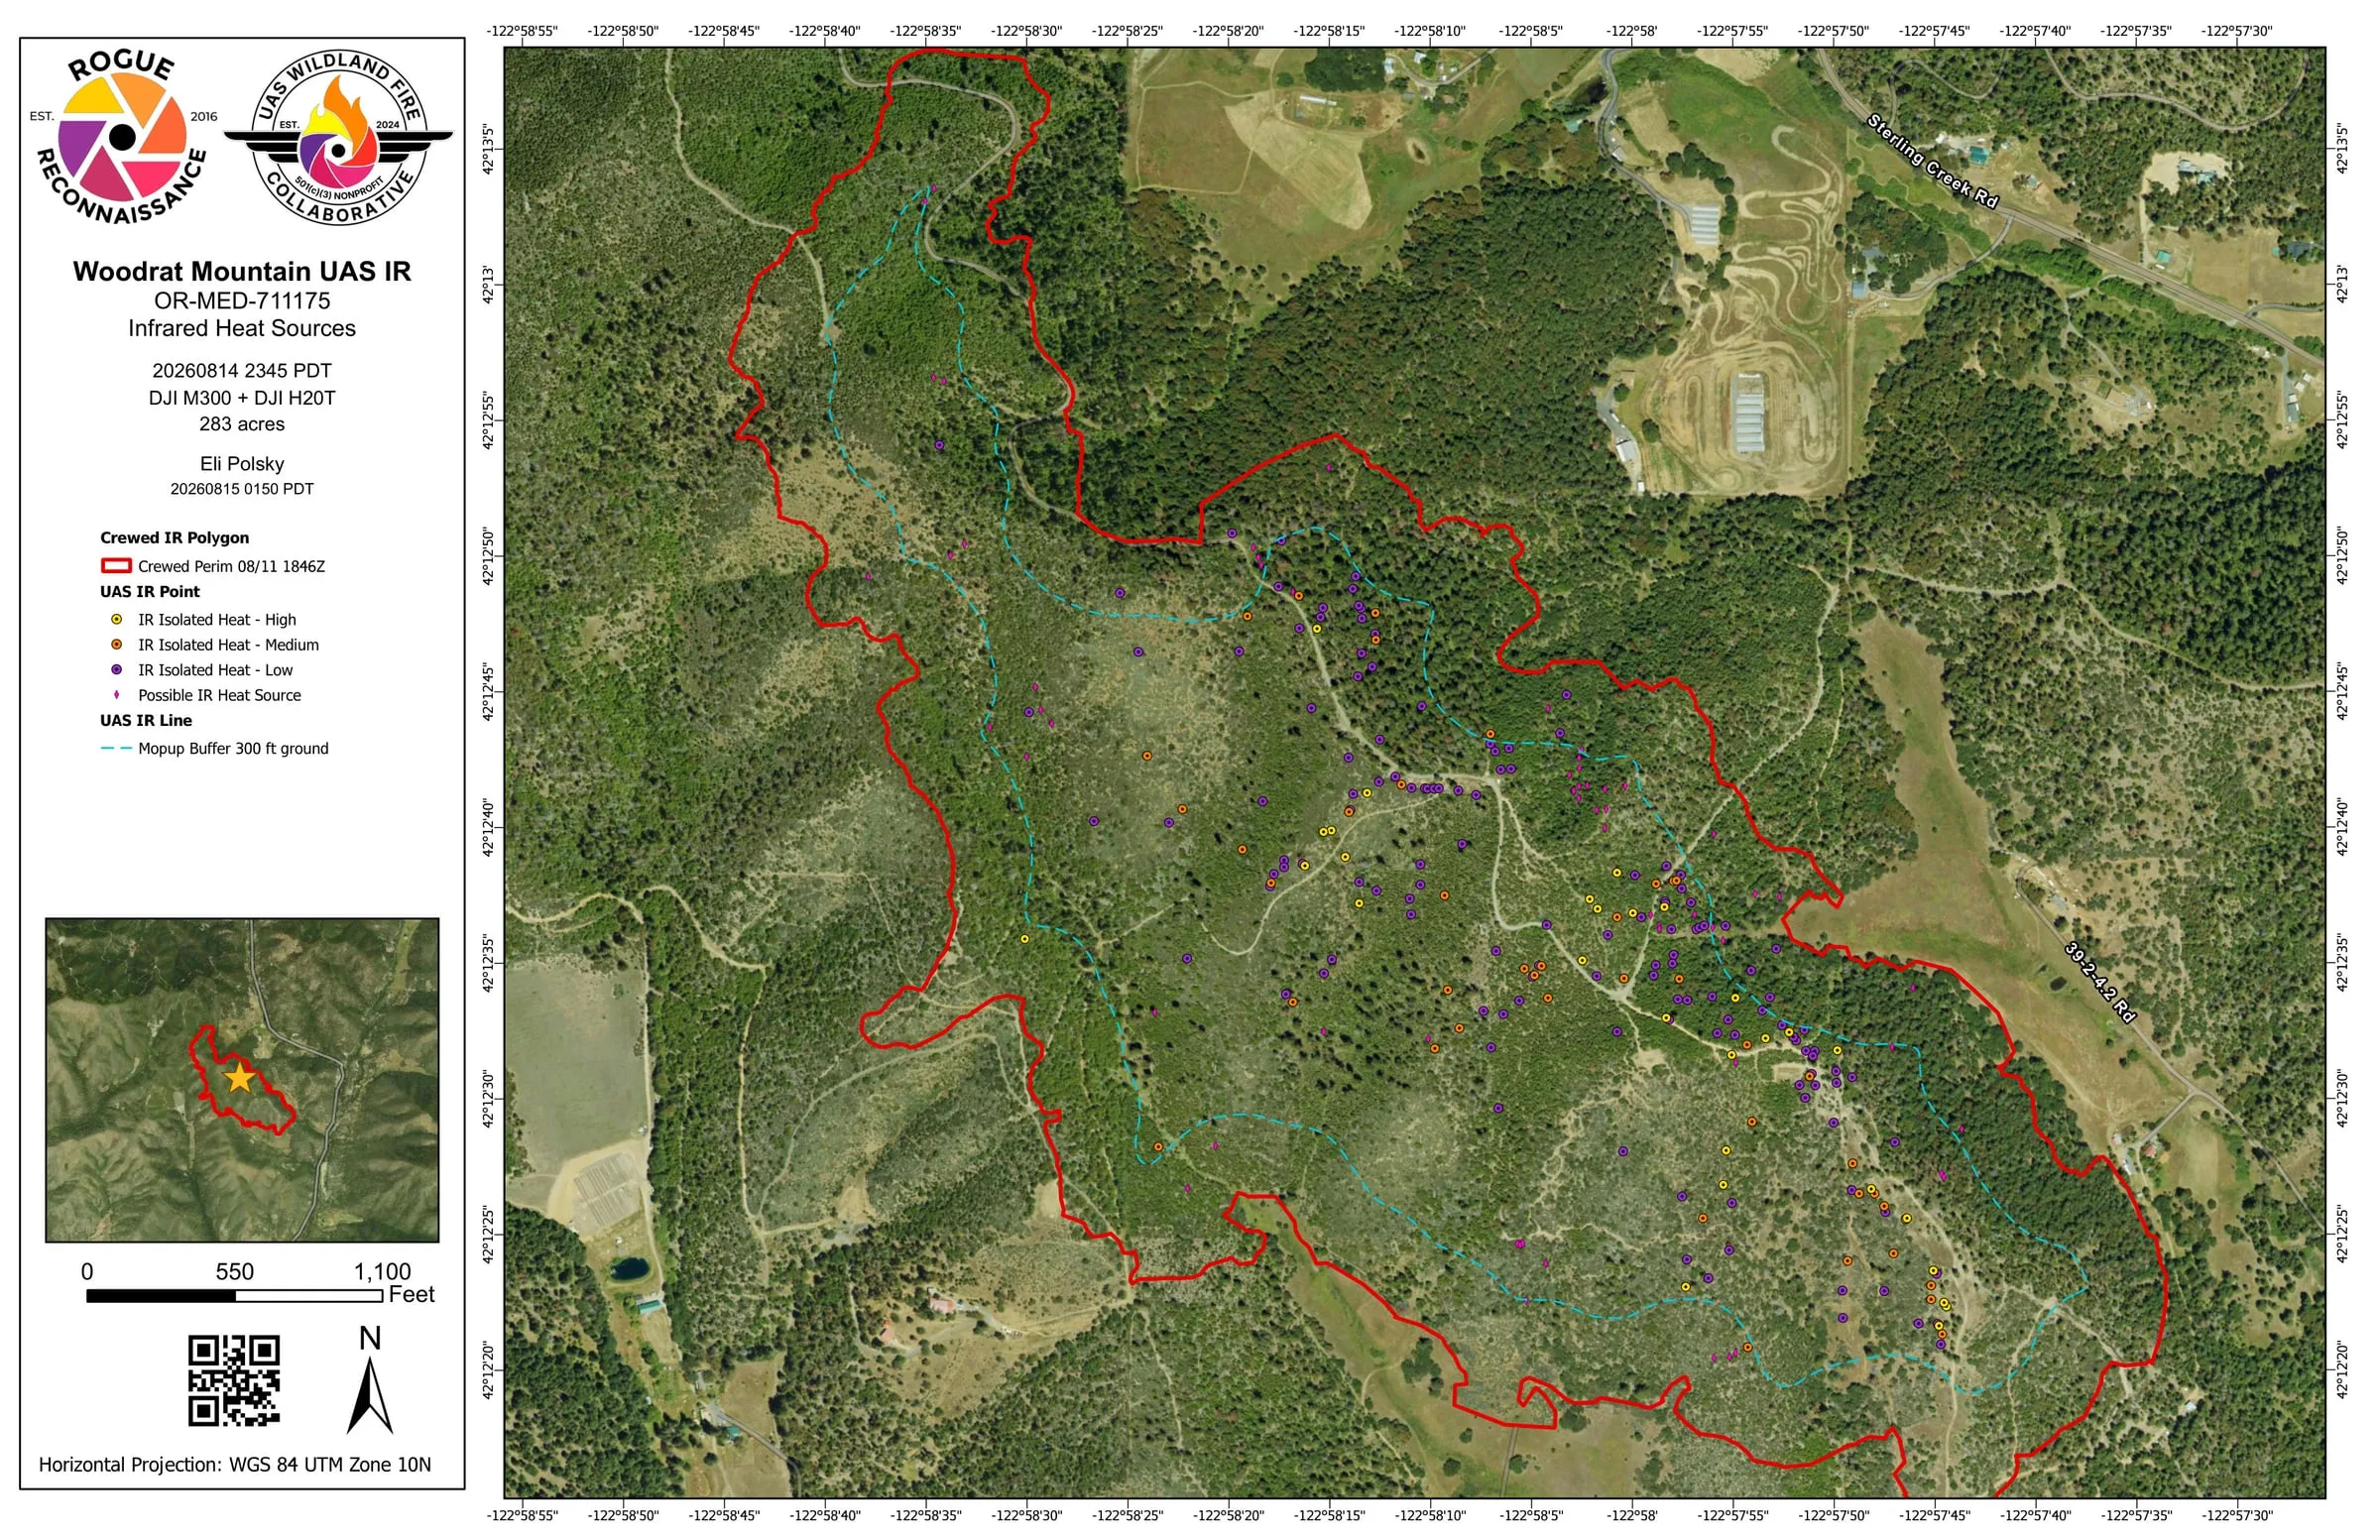
Eight nights later, on August 14, a second flight mapped the fire again, with a 300 foot mop up buffer. This time the pilot marked quite a few low intensity signatures as possible heat, because on earlier nights and from crews’ feedback, possible heat had been confirmed as real smoldering hot spots.
On August 19 the aircraft came over from Fielder Mountain for one more look. The objective on the record reads simply: recon for any remaining heat. The flight found almost nothing. The map carried no heat sources and five marked possible heat, with a 400 foot mop up buffer.
The possible heat was real
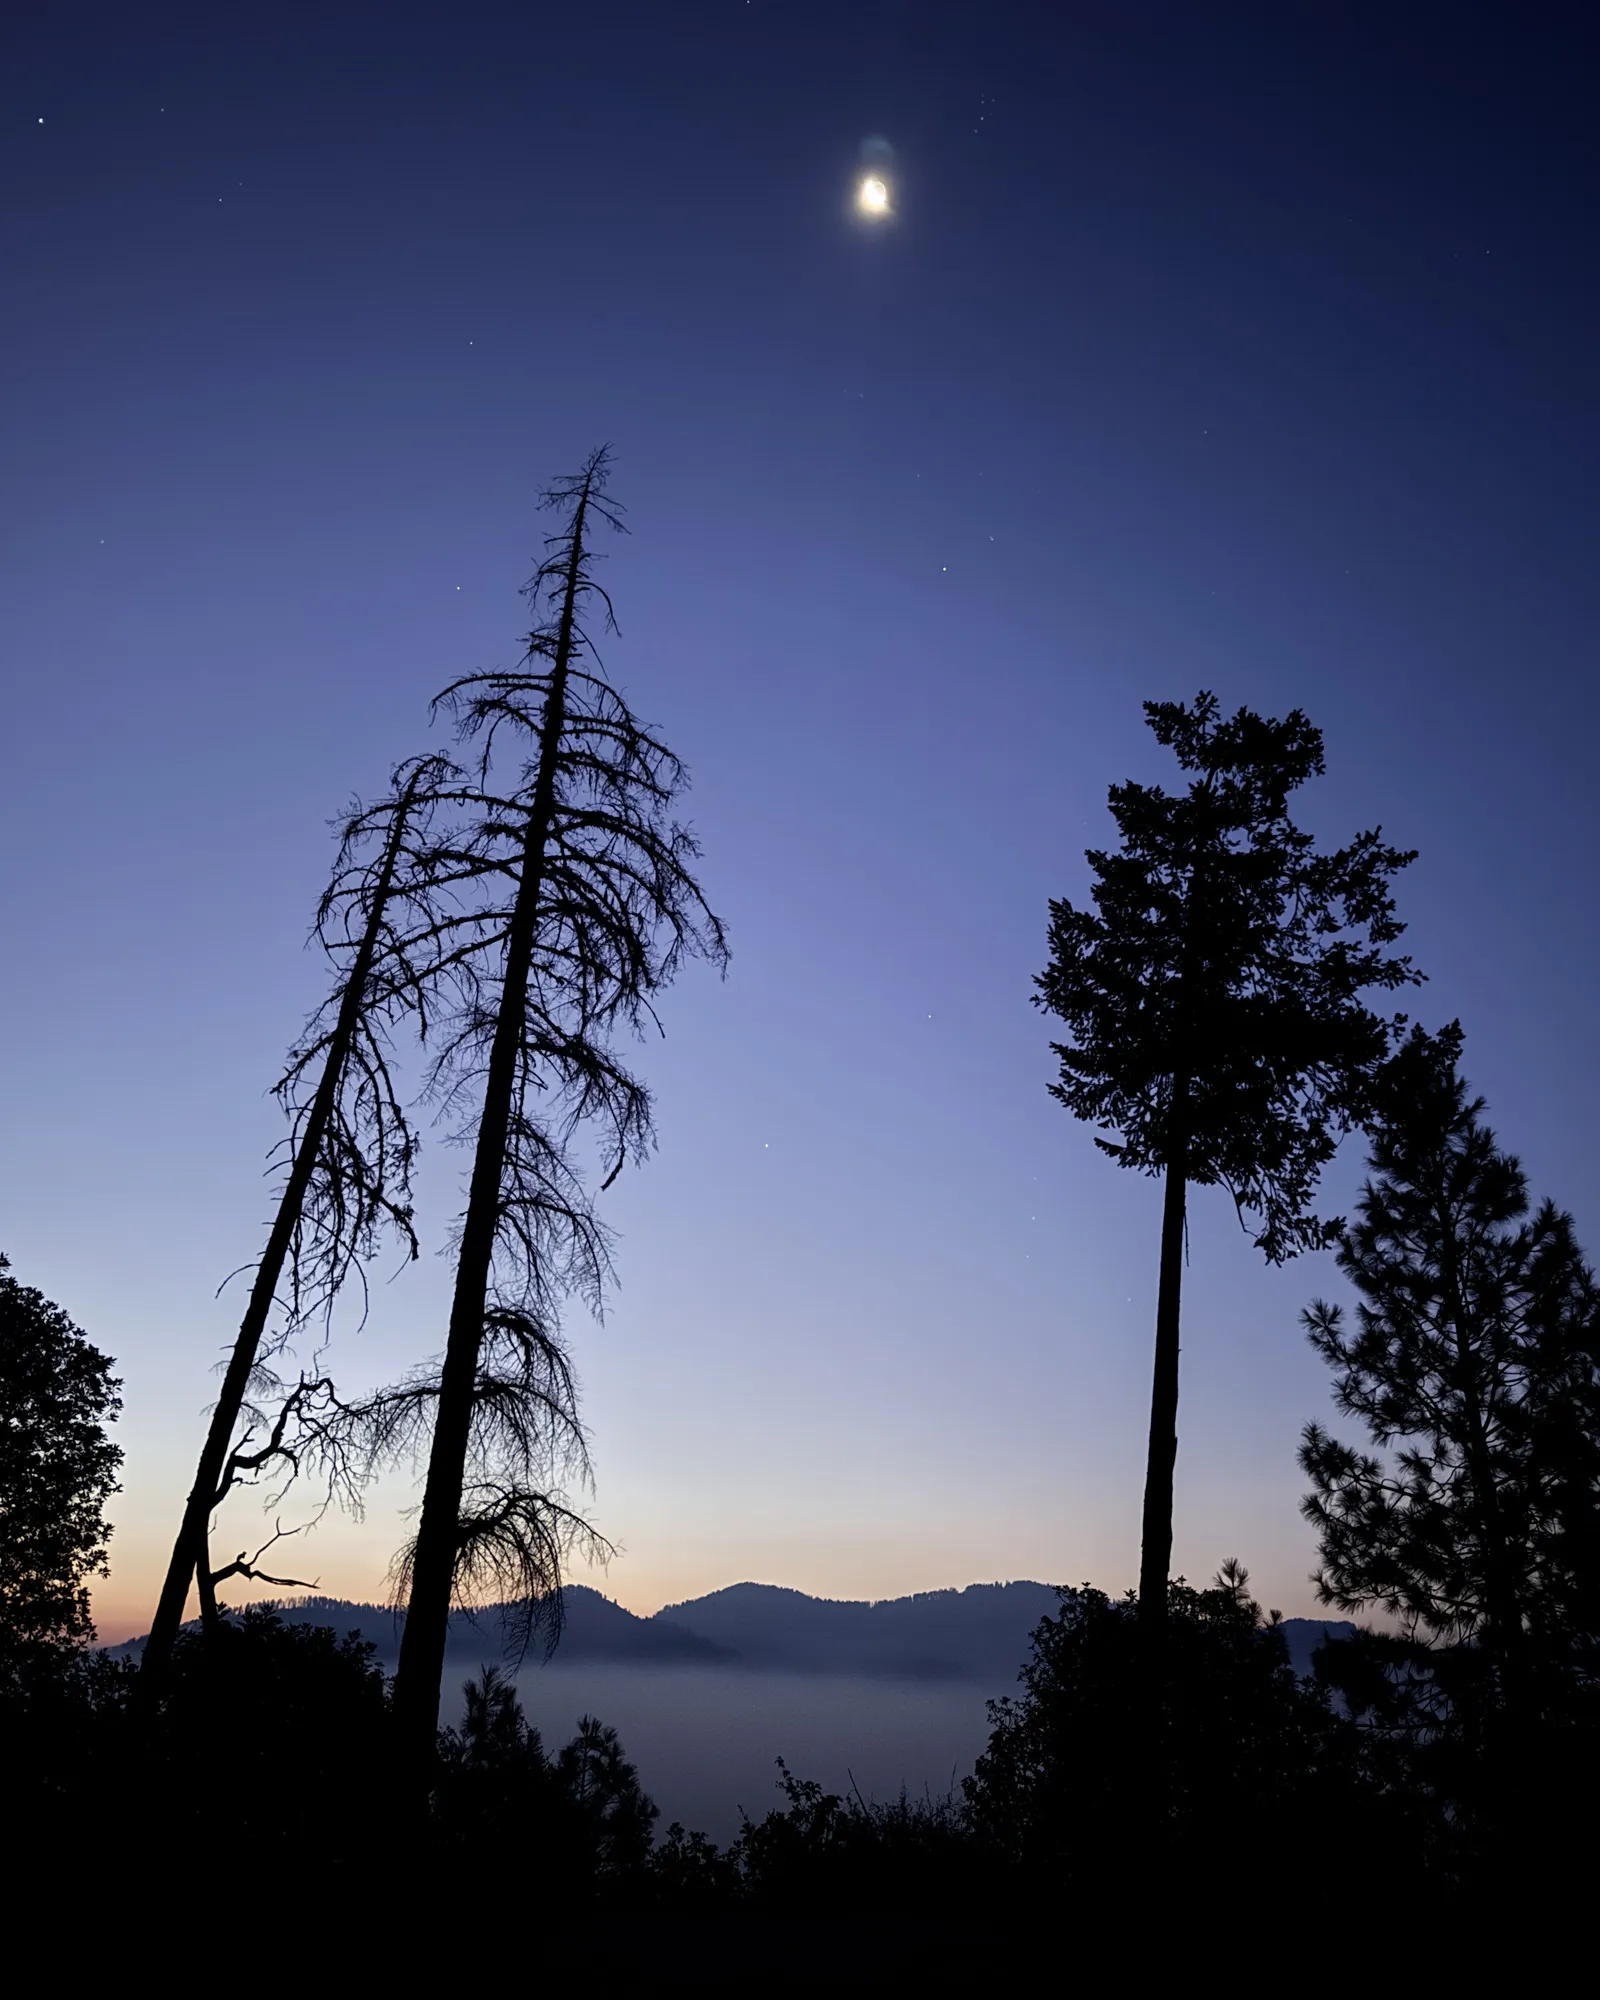
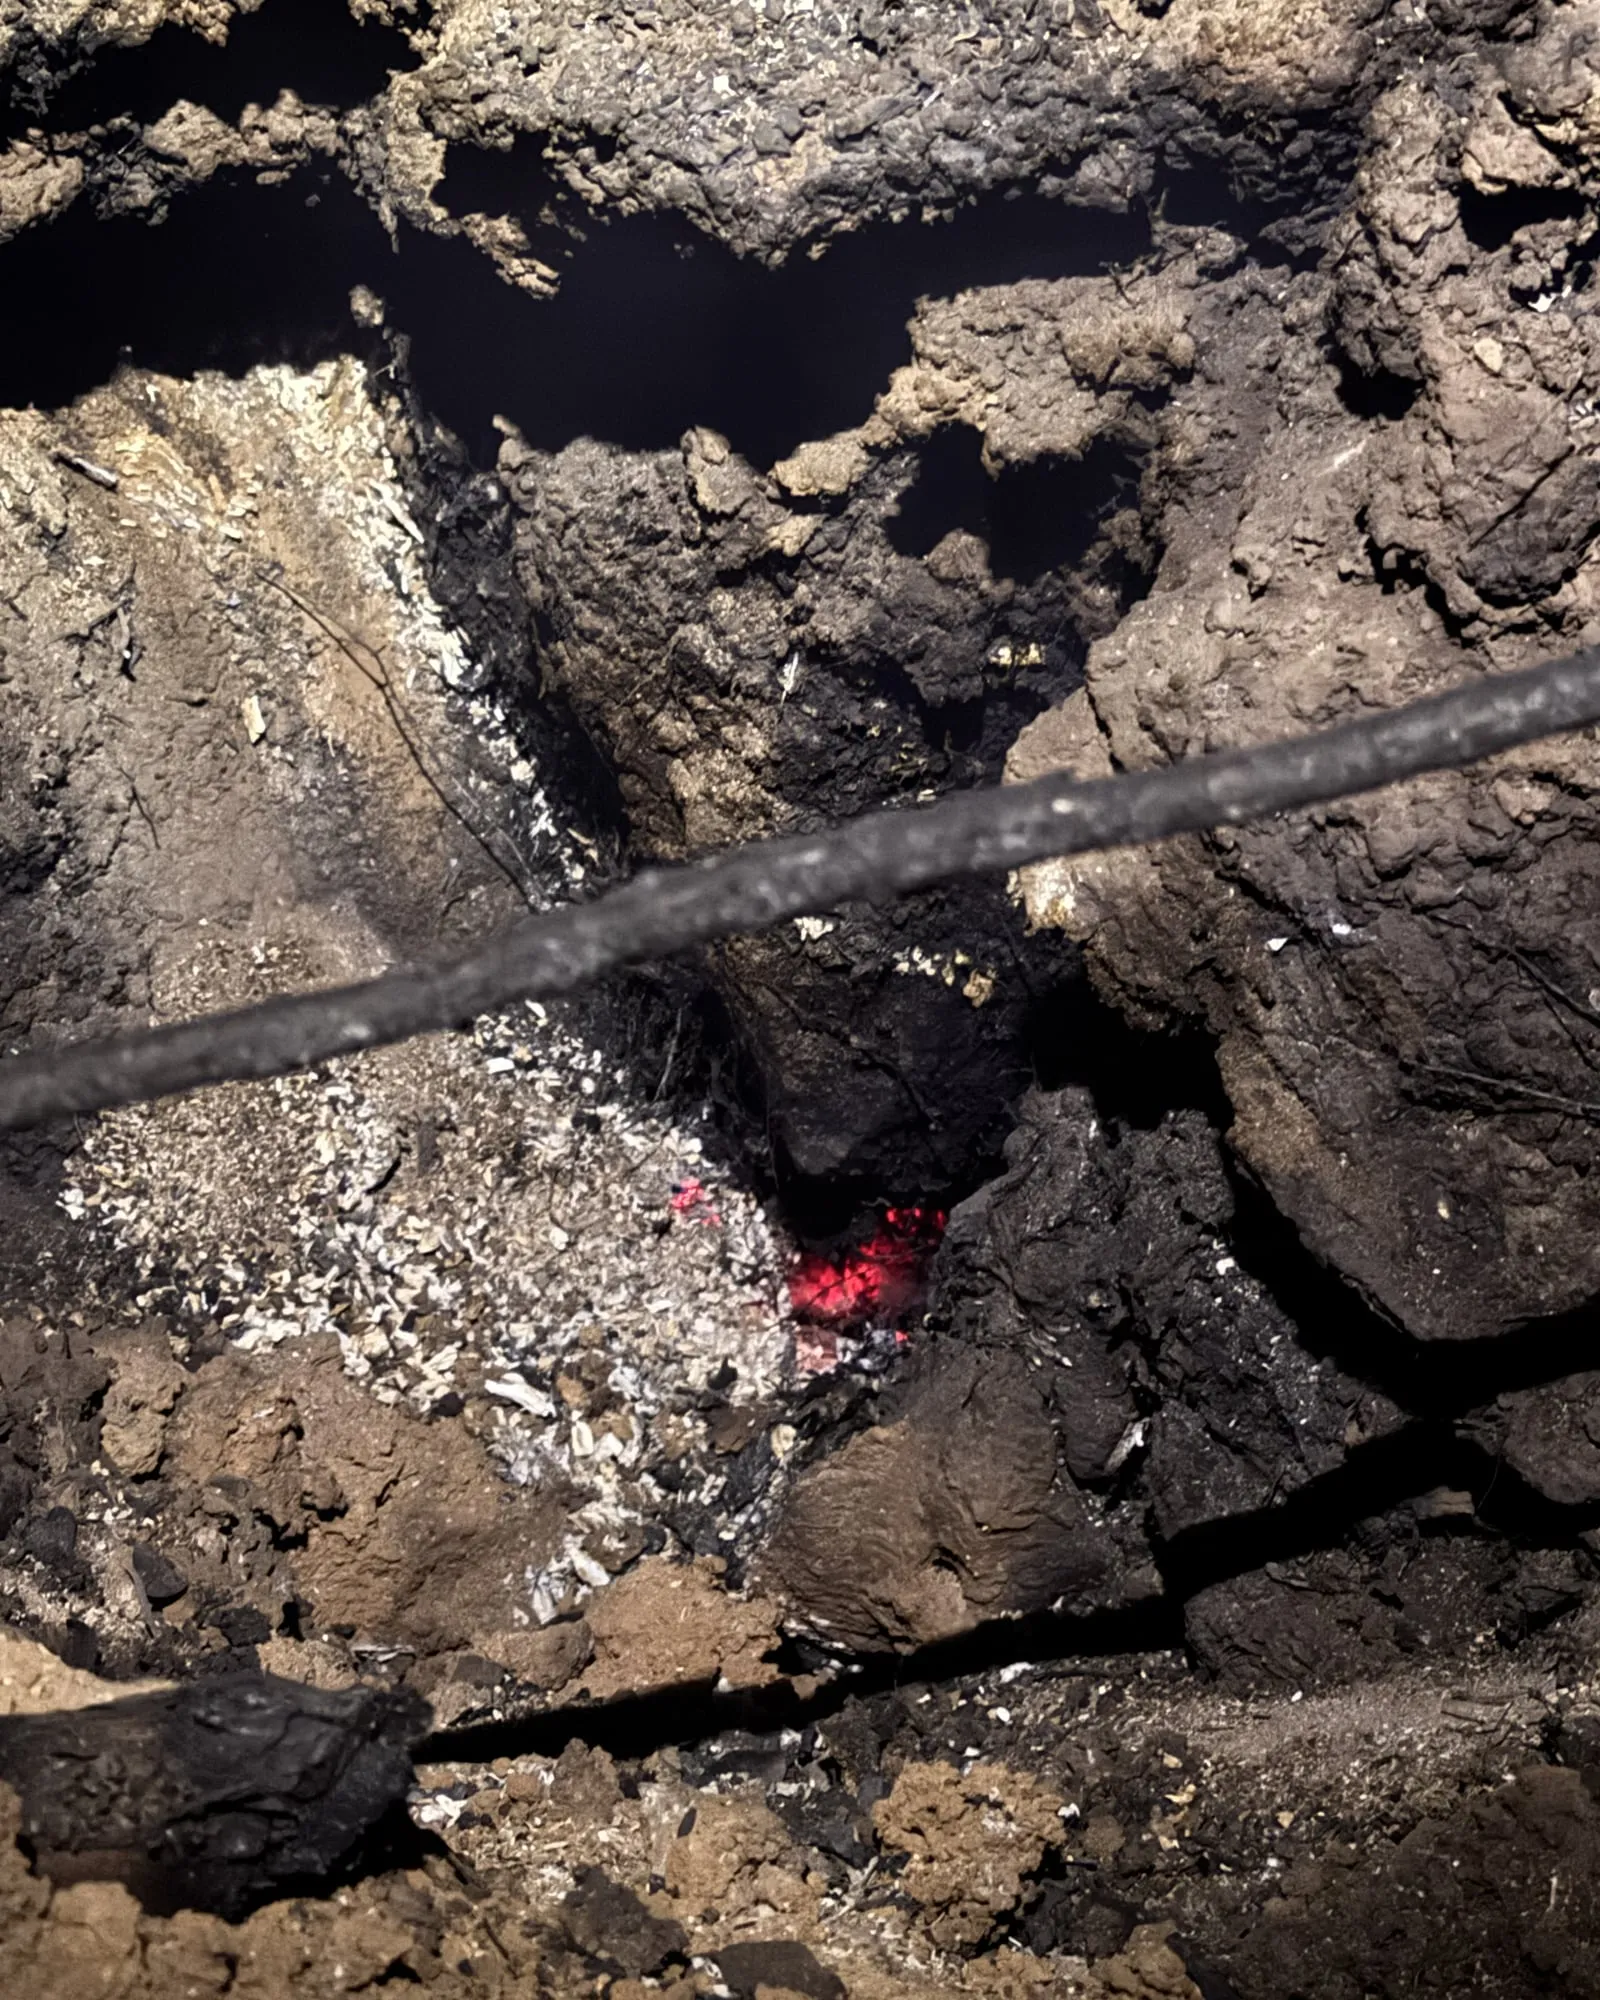
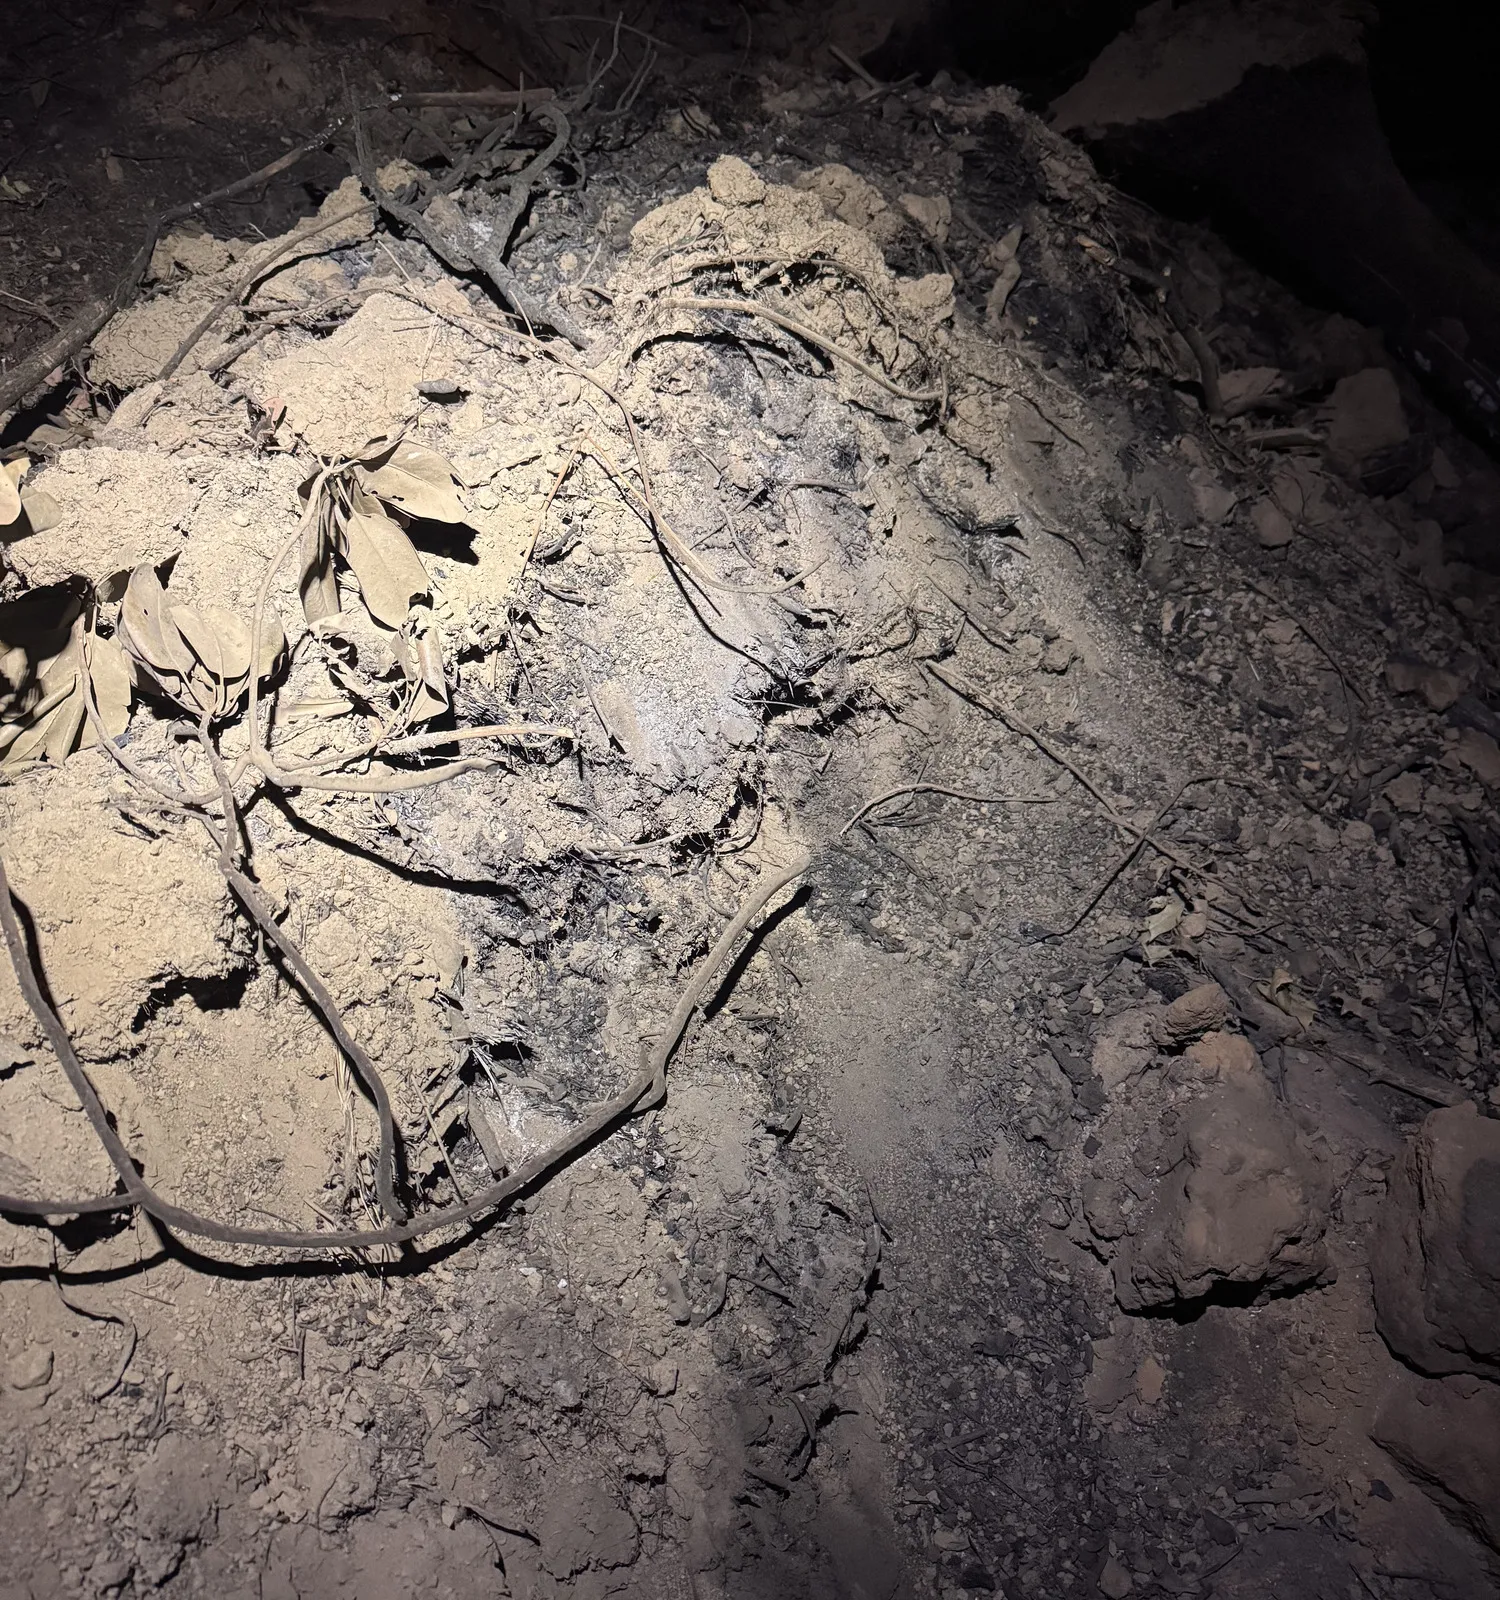
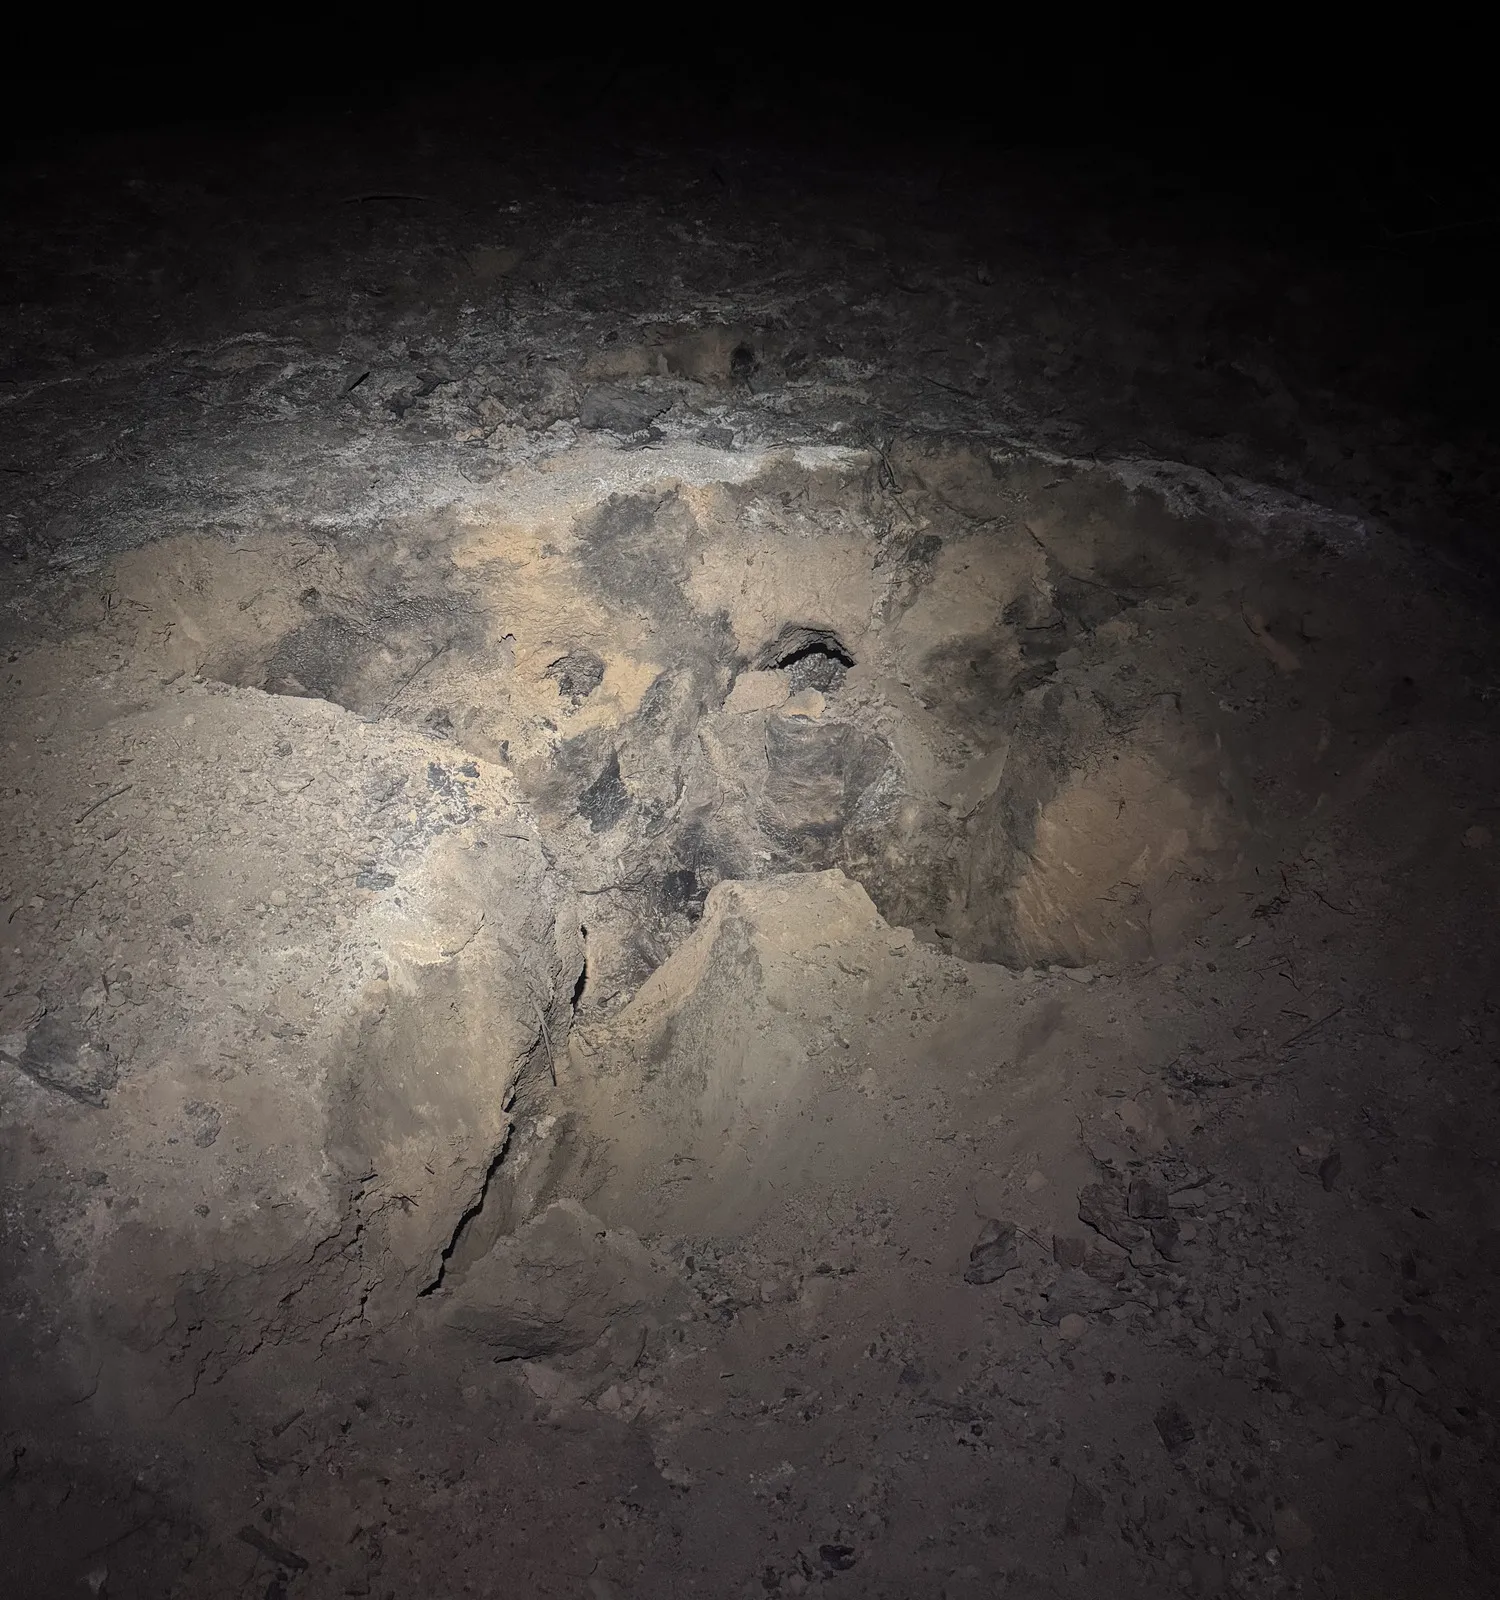
The next night the pilot walked the fire with the map on a phone, and found heat: embers glowing at the bottom of a stump hole, heat in a mound of ash and roots, and faint heat deep in another burned out stump hole.
That is the reason a signature the pilot is not sure about goes on the map as possible heat, rather than being left off.
On the ground
The fire, up close
What the Collaborative did
One flying team. The system did the rest.
Every map set on this fire came back as two thermal map sheets, one on aerial imagery and one on a topographic base, with a daily log, a Google Earth file and the GIS layers, on the flying organization’s own template.
- 24 files in the public archive Filed by night under the folder and file names the interagency share uses, free for anyone to open.
- 2 map sets carry the daily fire perimeter The incident’s own interagency perimeter, pulled onto the map in red beside the drone’s pink heat.
- 78 min median, upload to approved maps Across 4 map sets with both times on the record, including the pilot’s own review before approving.
- 300 to 400 ft mop up buffers drawn Dashed lines a set distance in from the perimeter, measured along the ground, so a crew can see which heat sits close to the edge.
How a map is made
The first night on Woodrat Mountain, layer by layer
The whole fire at 3:39 am on August 7, the night it was reported. First the stitched thermal mosaic from that flight, then each layer the delivered map set draws on top of it.
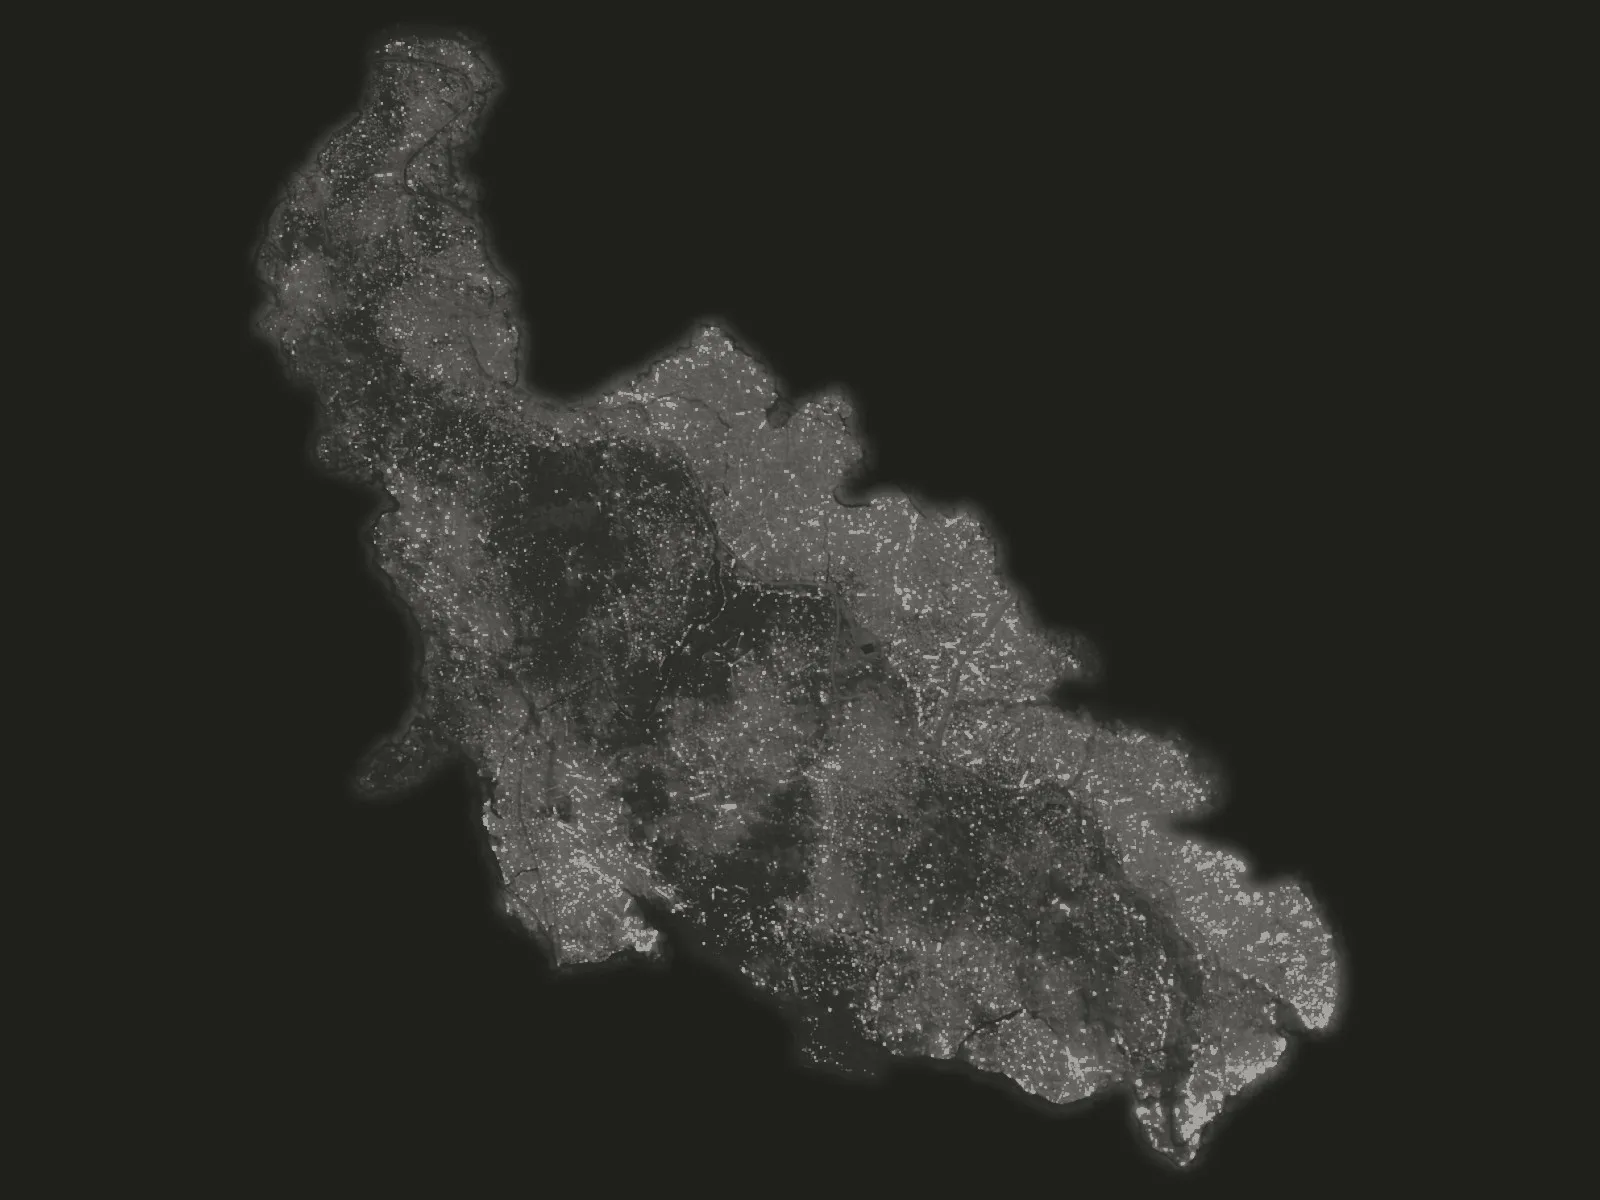
- The thermal mosaic Hundreds of thermal frames from one night's flight, stitched into one thermal image of the ground. The whiter the ground, the warmer it reads.
- IR heat perimeter The outer edge of the heat, as the pilot mapped it, drawn in pink because a drone flew it.
- Intense and scattered heat Hatched where the heat is continuous. Dotted where many small heat sources sit close together.
- 399 isolated heat sources Each single heat source outside those areas, a pink dot with a black ring. Each is a place a crew can walk to.
- 7 spot fires A new fire outside the main perimeter, marked with a larger symbol.
-
Pink is a drone. Red came from elsewhere: a crewed aircraft's map or the incident's daily fire perimeter. Every map the Collaborative makes follows that rule, so anyone on the fire can see at a glance what the drone found.
How to read the map
Delivered to the incident
More thermal map sheets from Woodrat Mountain
Pink is a drone Red came from elsewhere How to read the map
The archive, night by night
Every map set
4 map sets over 3 nights
One row per map set, grouped by night. A flight after midnight counts with the night before it, and the archive files each night under the next day's date, the operational period its maps served. Where two flights covered the same ground in one night, a heat source can appear on both maps, so the nightly numbers are not added into a trend.
| Night | Flown | Area | Heat sources | Possible heat | Mop up buffer | Archive |
|---|---|---|---|---|---|---|
| August 6 | 11:30 pm | Perimeter scan | 0 | 0 | None | Open the night |
| 3:39 am | Whole fire | 399 | 0 | None | ||
| August 14 | 11:45 pm | Whole fire | 203 | 60 | 300 ft | Open the night |
| August 19 | 12:12 am | Whole fire | 0 | 5 | 400 ft | Open the night |
Counted September 13, 2026 from the submission records and the public archive.
Where the images came from
- Every sheet on this page is the PDF delivered to the incident and published in the public archive, rendered as an image without changes. Each links to its PDF.
- Photographs by Rogue Reconnaissance, the founder's company, dated from each photo's own record.
More from the 2026 season
Other case studies
-
Cottonwood
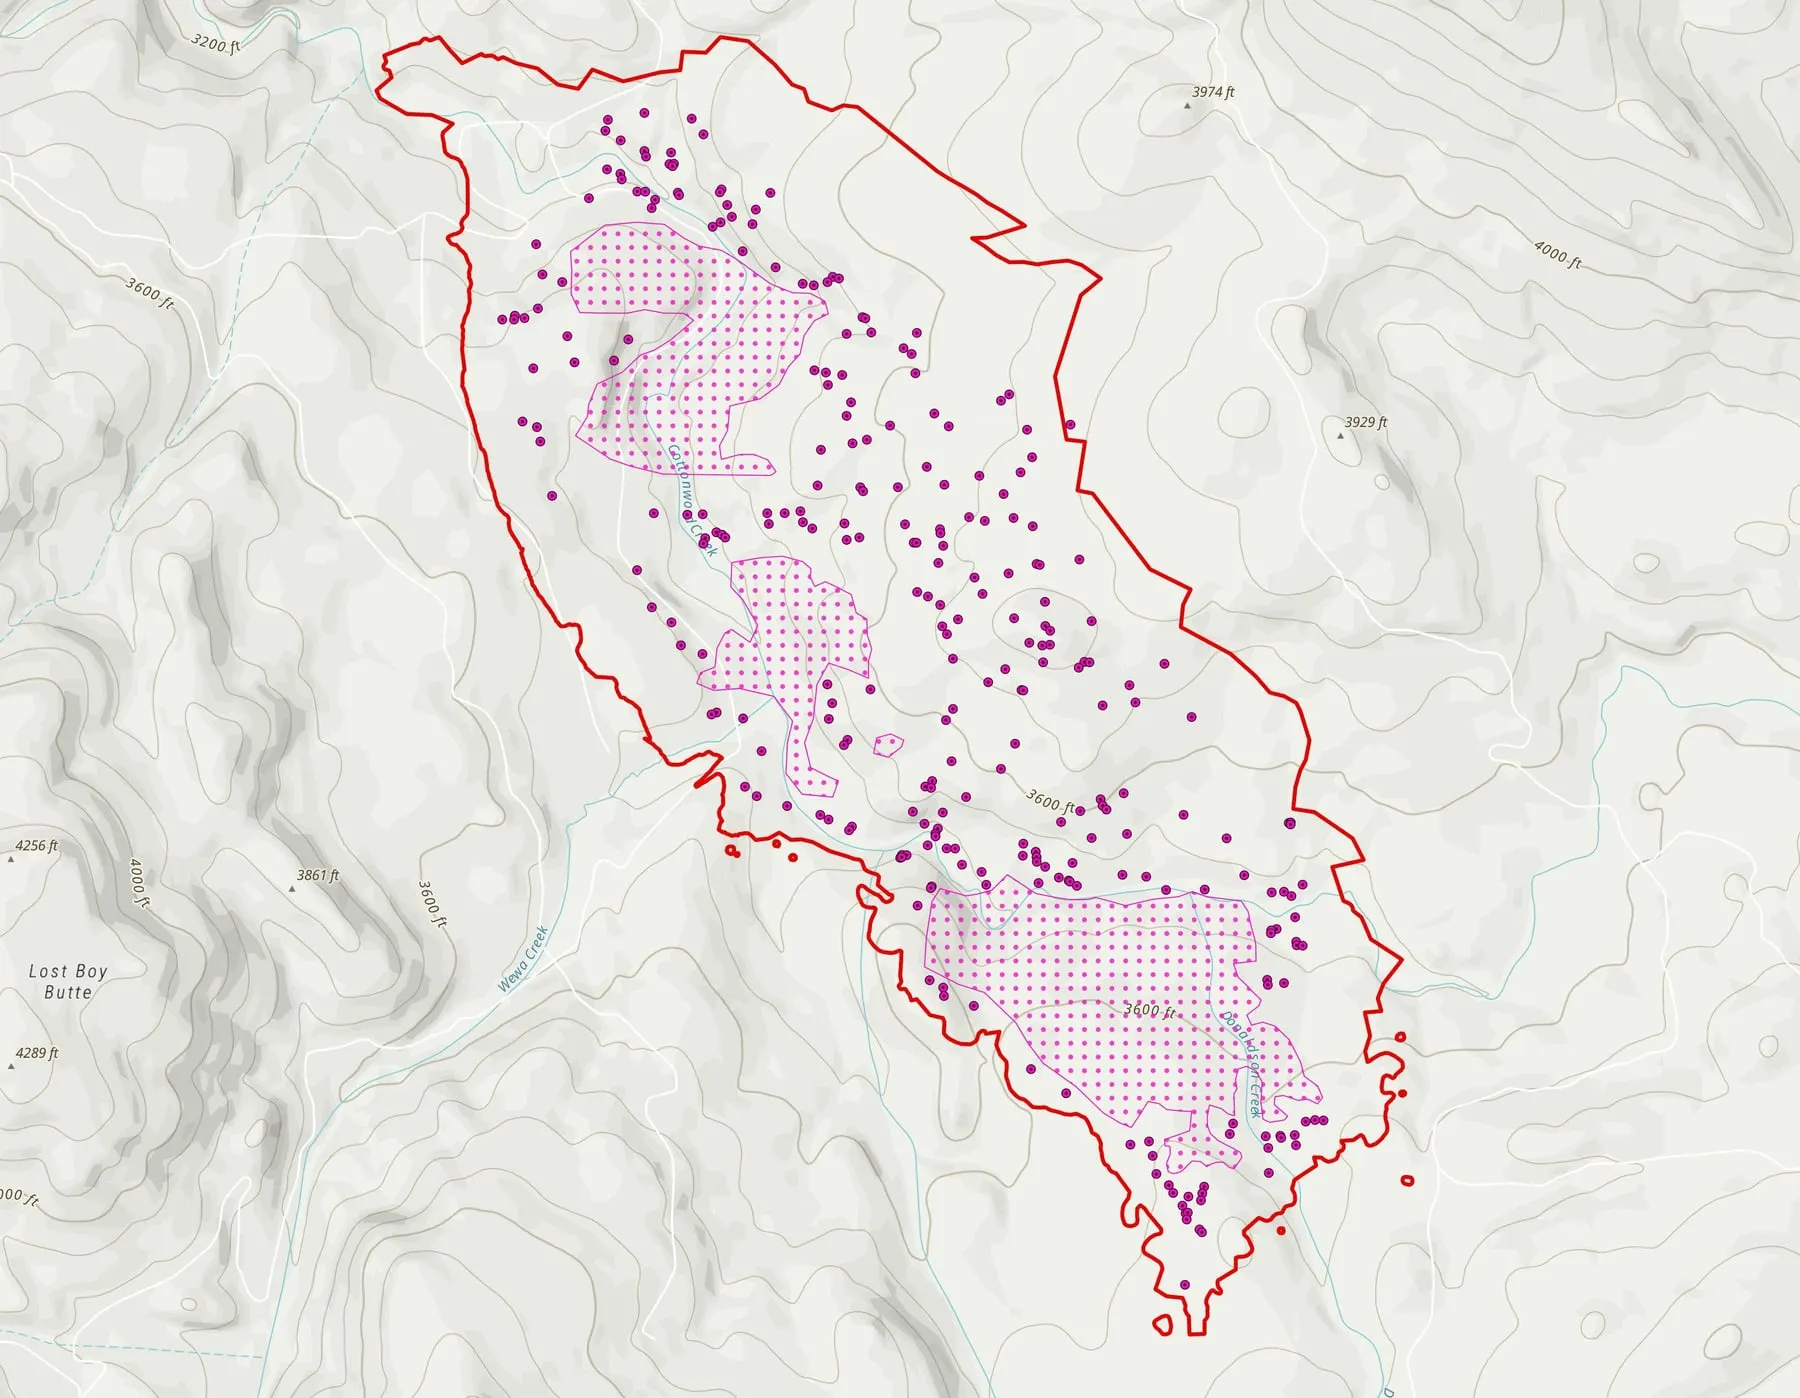
Two organizations, five nights apart, and two ways of drawing heat on the same fire, point by point and as areas.
-
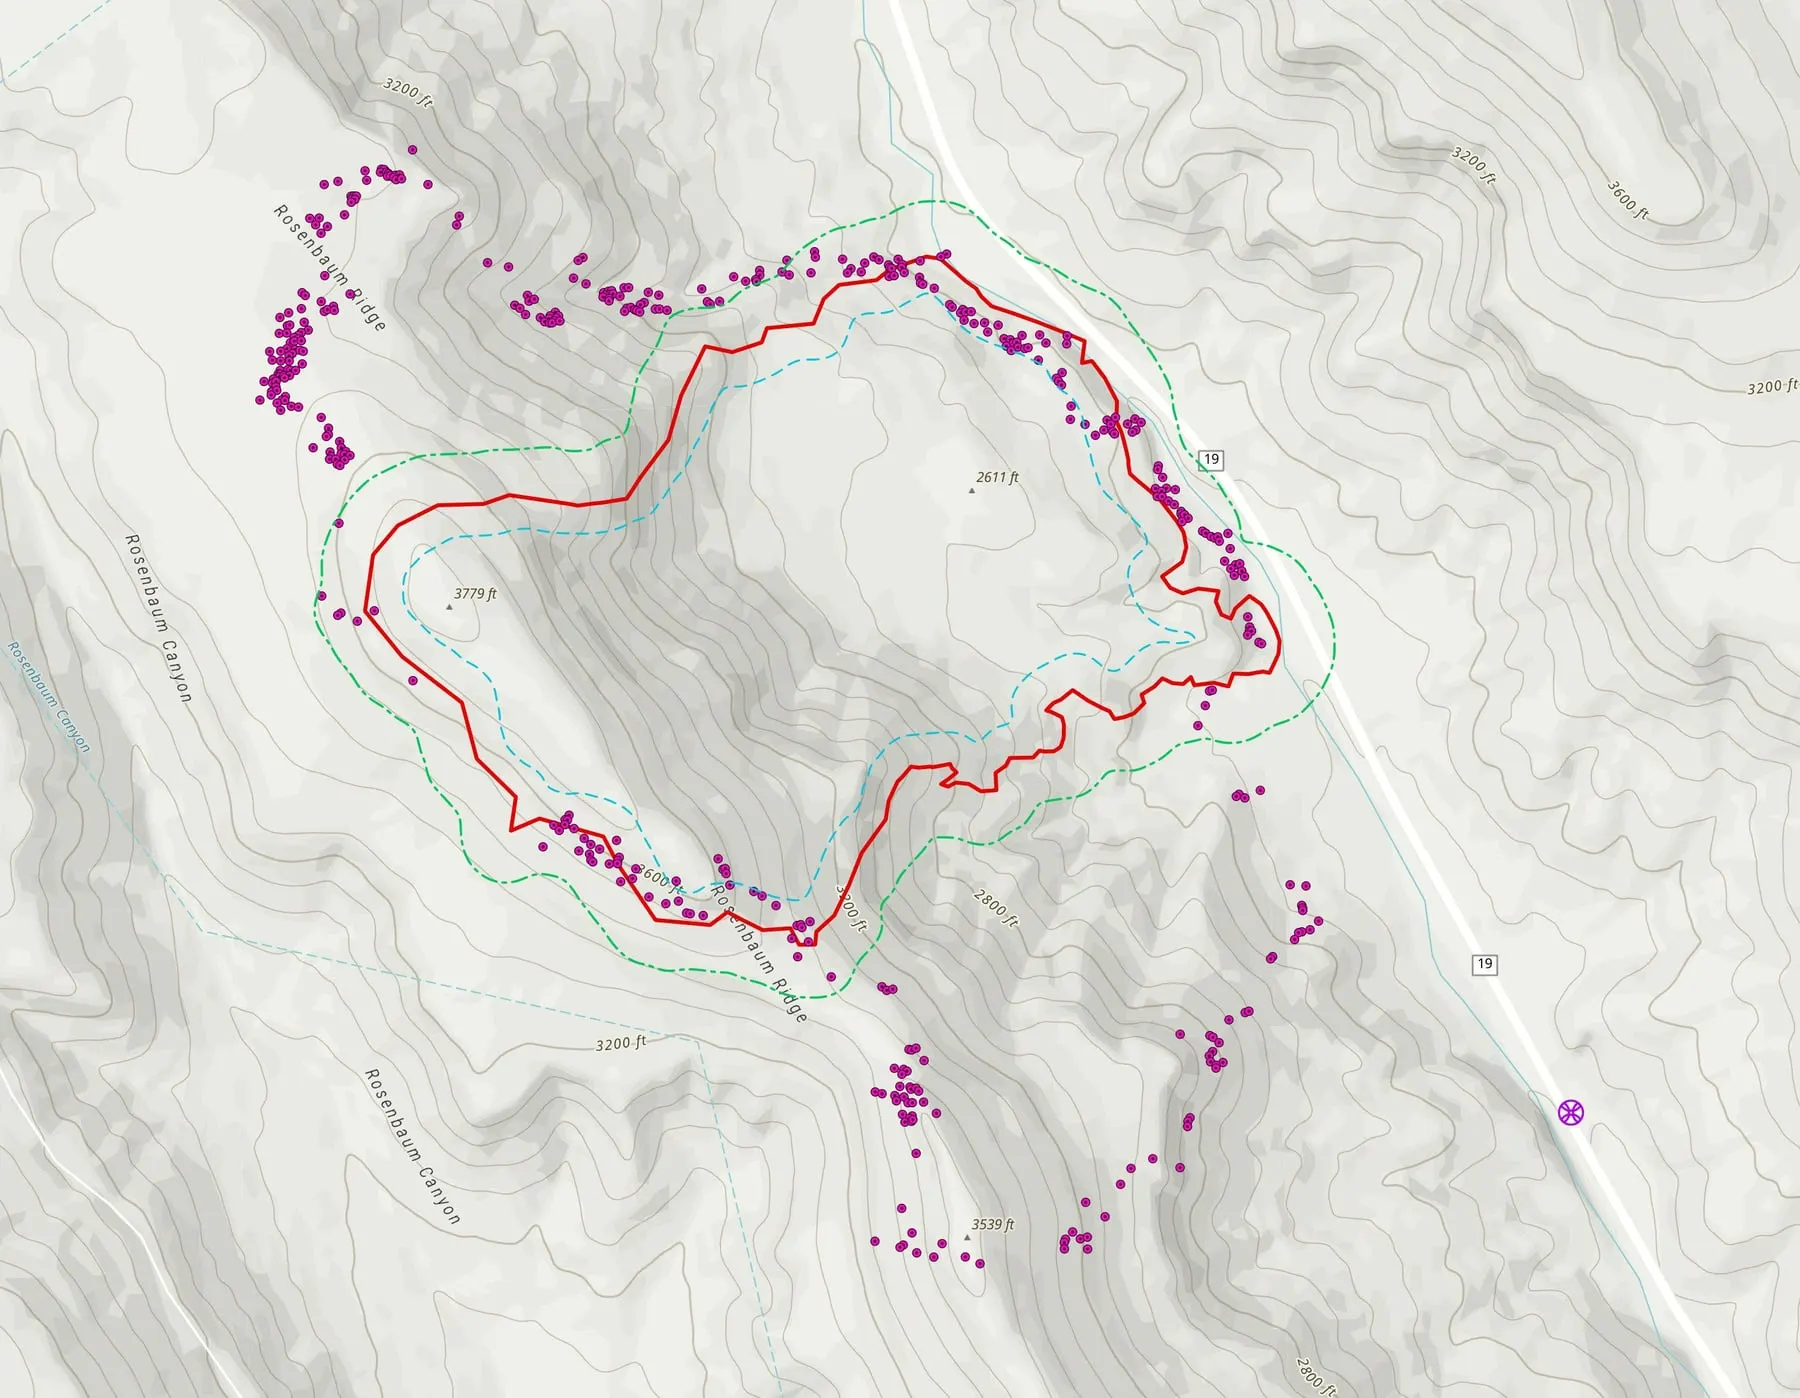
Rosenbaum
Mapped the night it was reported, then scanned before dawn three mornings running, with the heat that sat beyond the daily fire perimeter on the map.
-
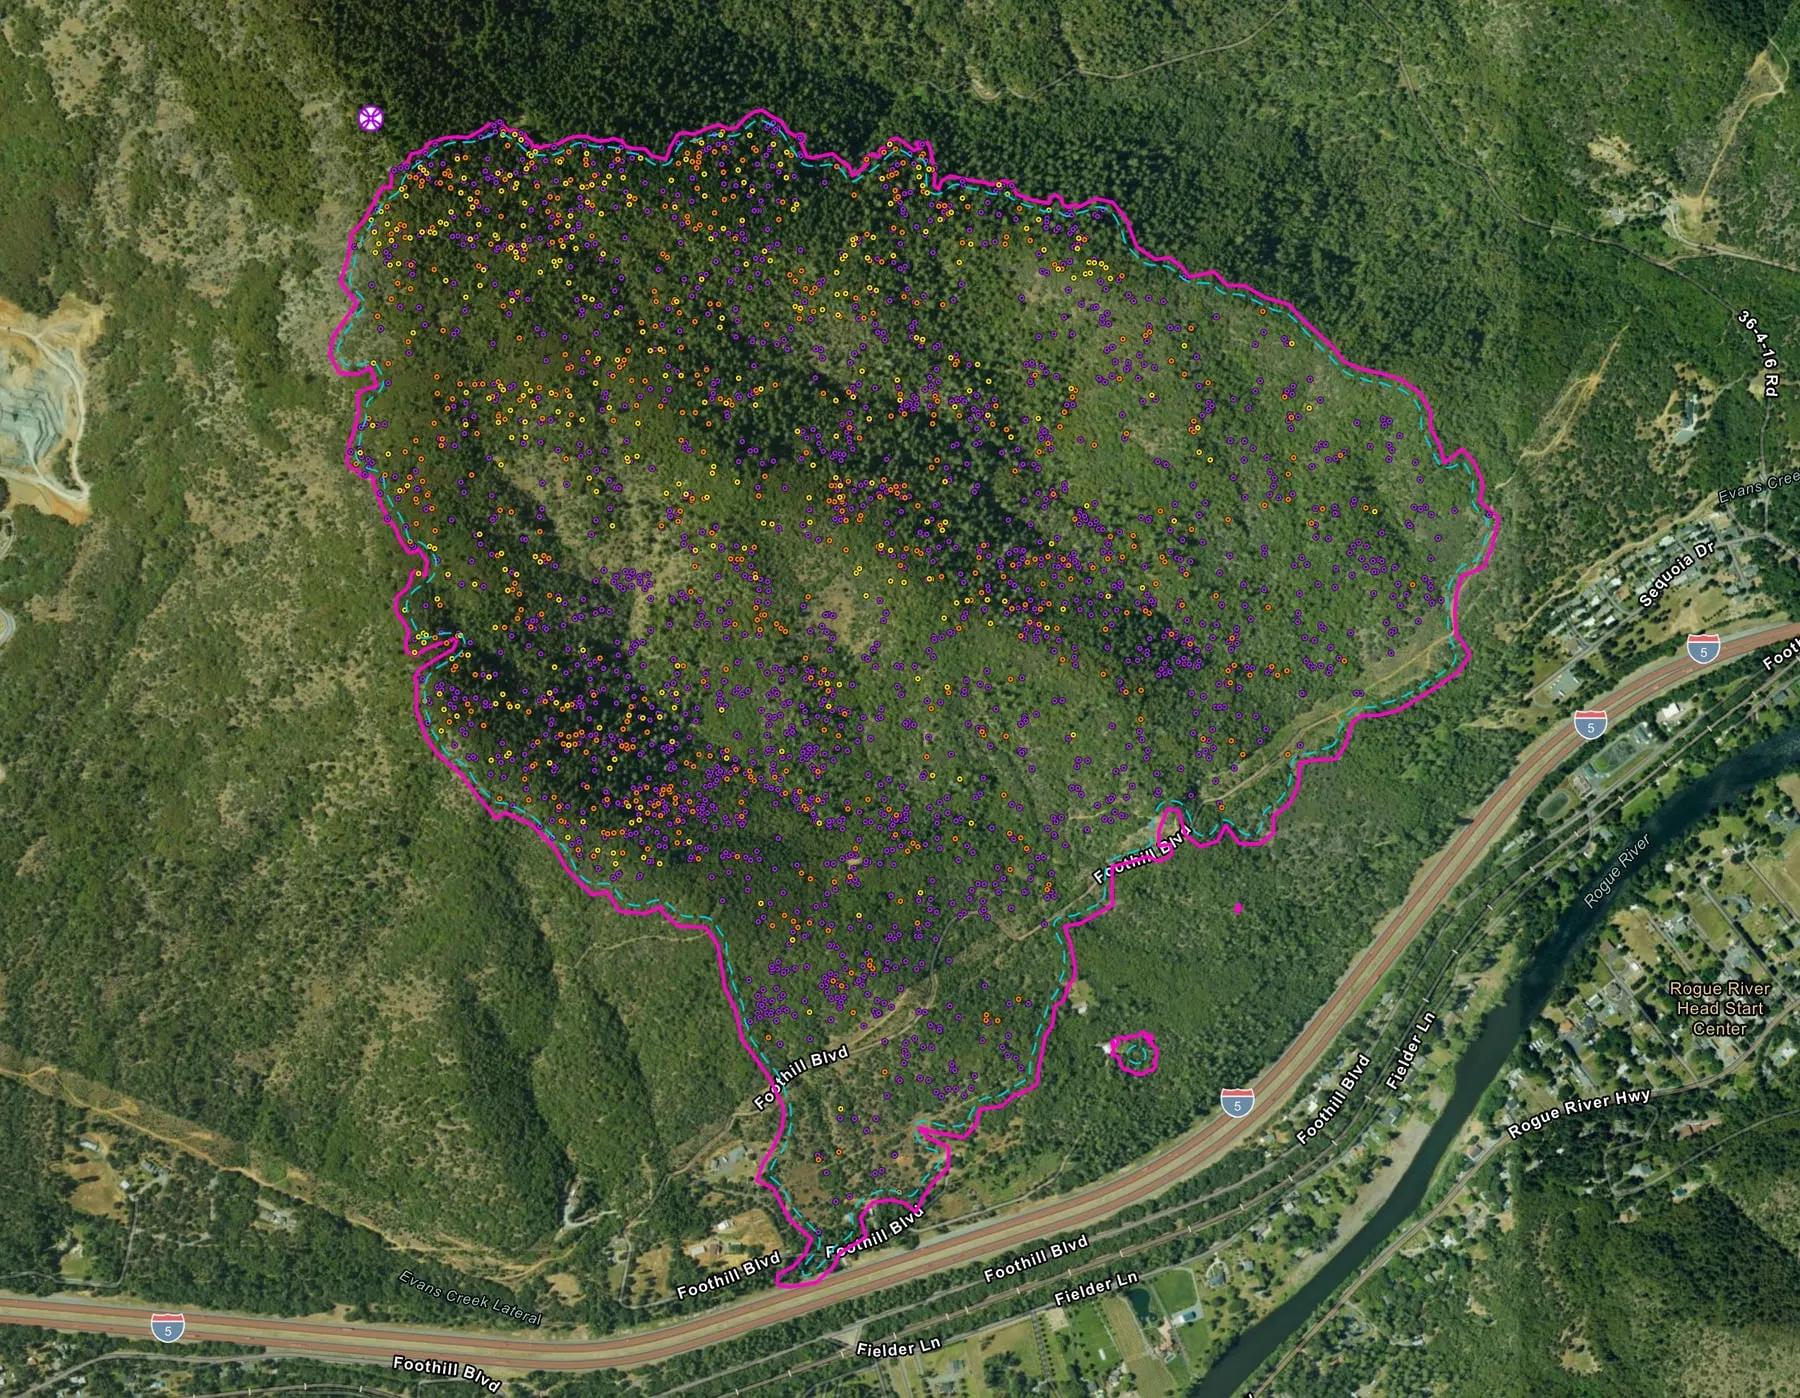
Fielder Mountain
Night after night over the same steep ground, and what happened to the heat inside a perimeter that never moved.
Support the Collaborative
Every sheet on this page went to the incident.
A gift keeps the system running for the next fire, so the heat still in the ground reaches the incident on a sheet like these.