UAS Wildland Fire Collaborative seal
Donate
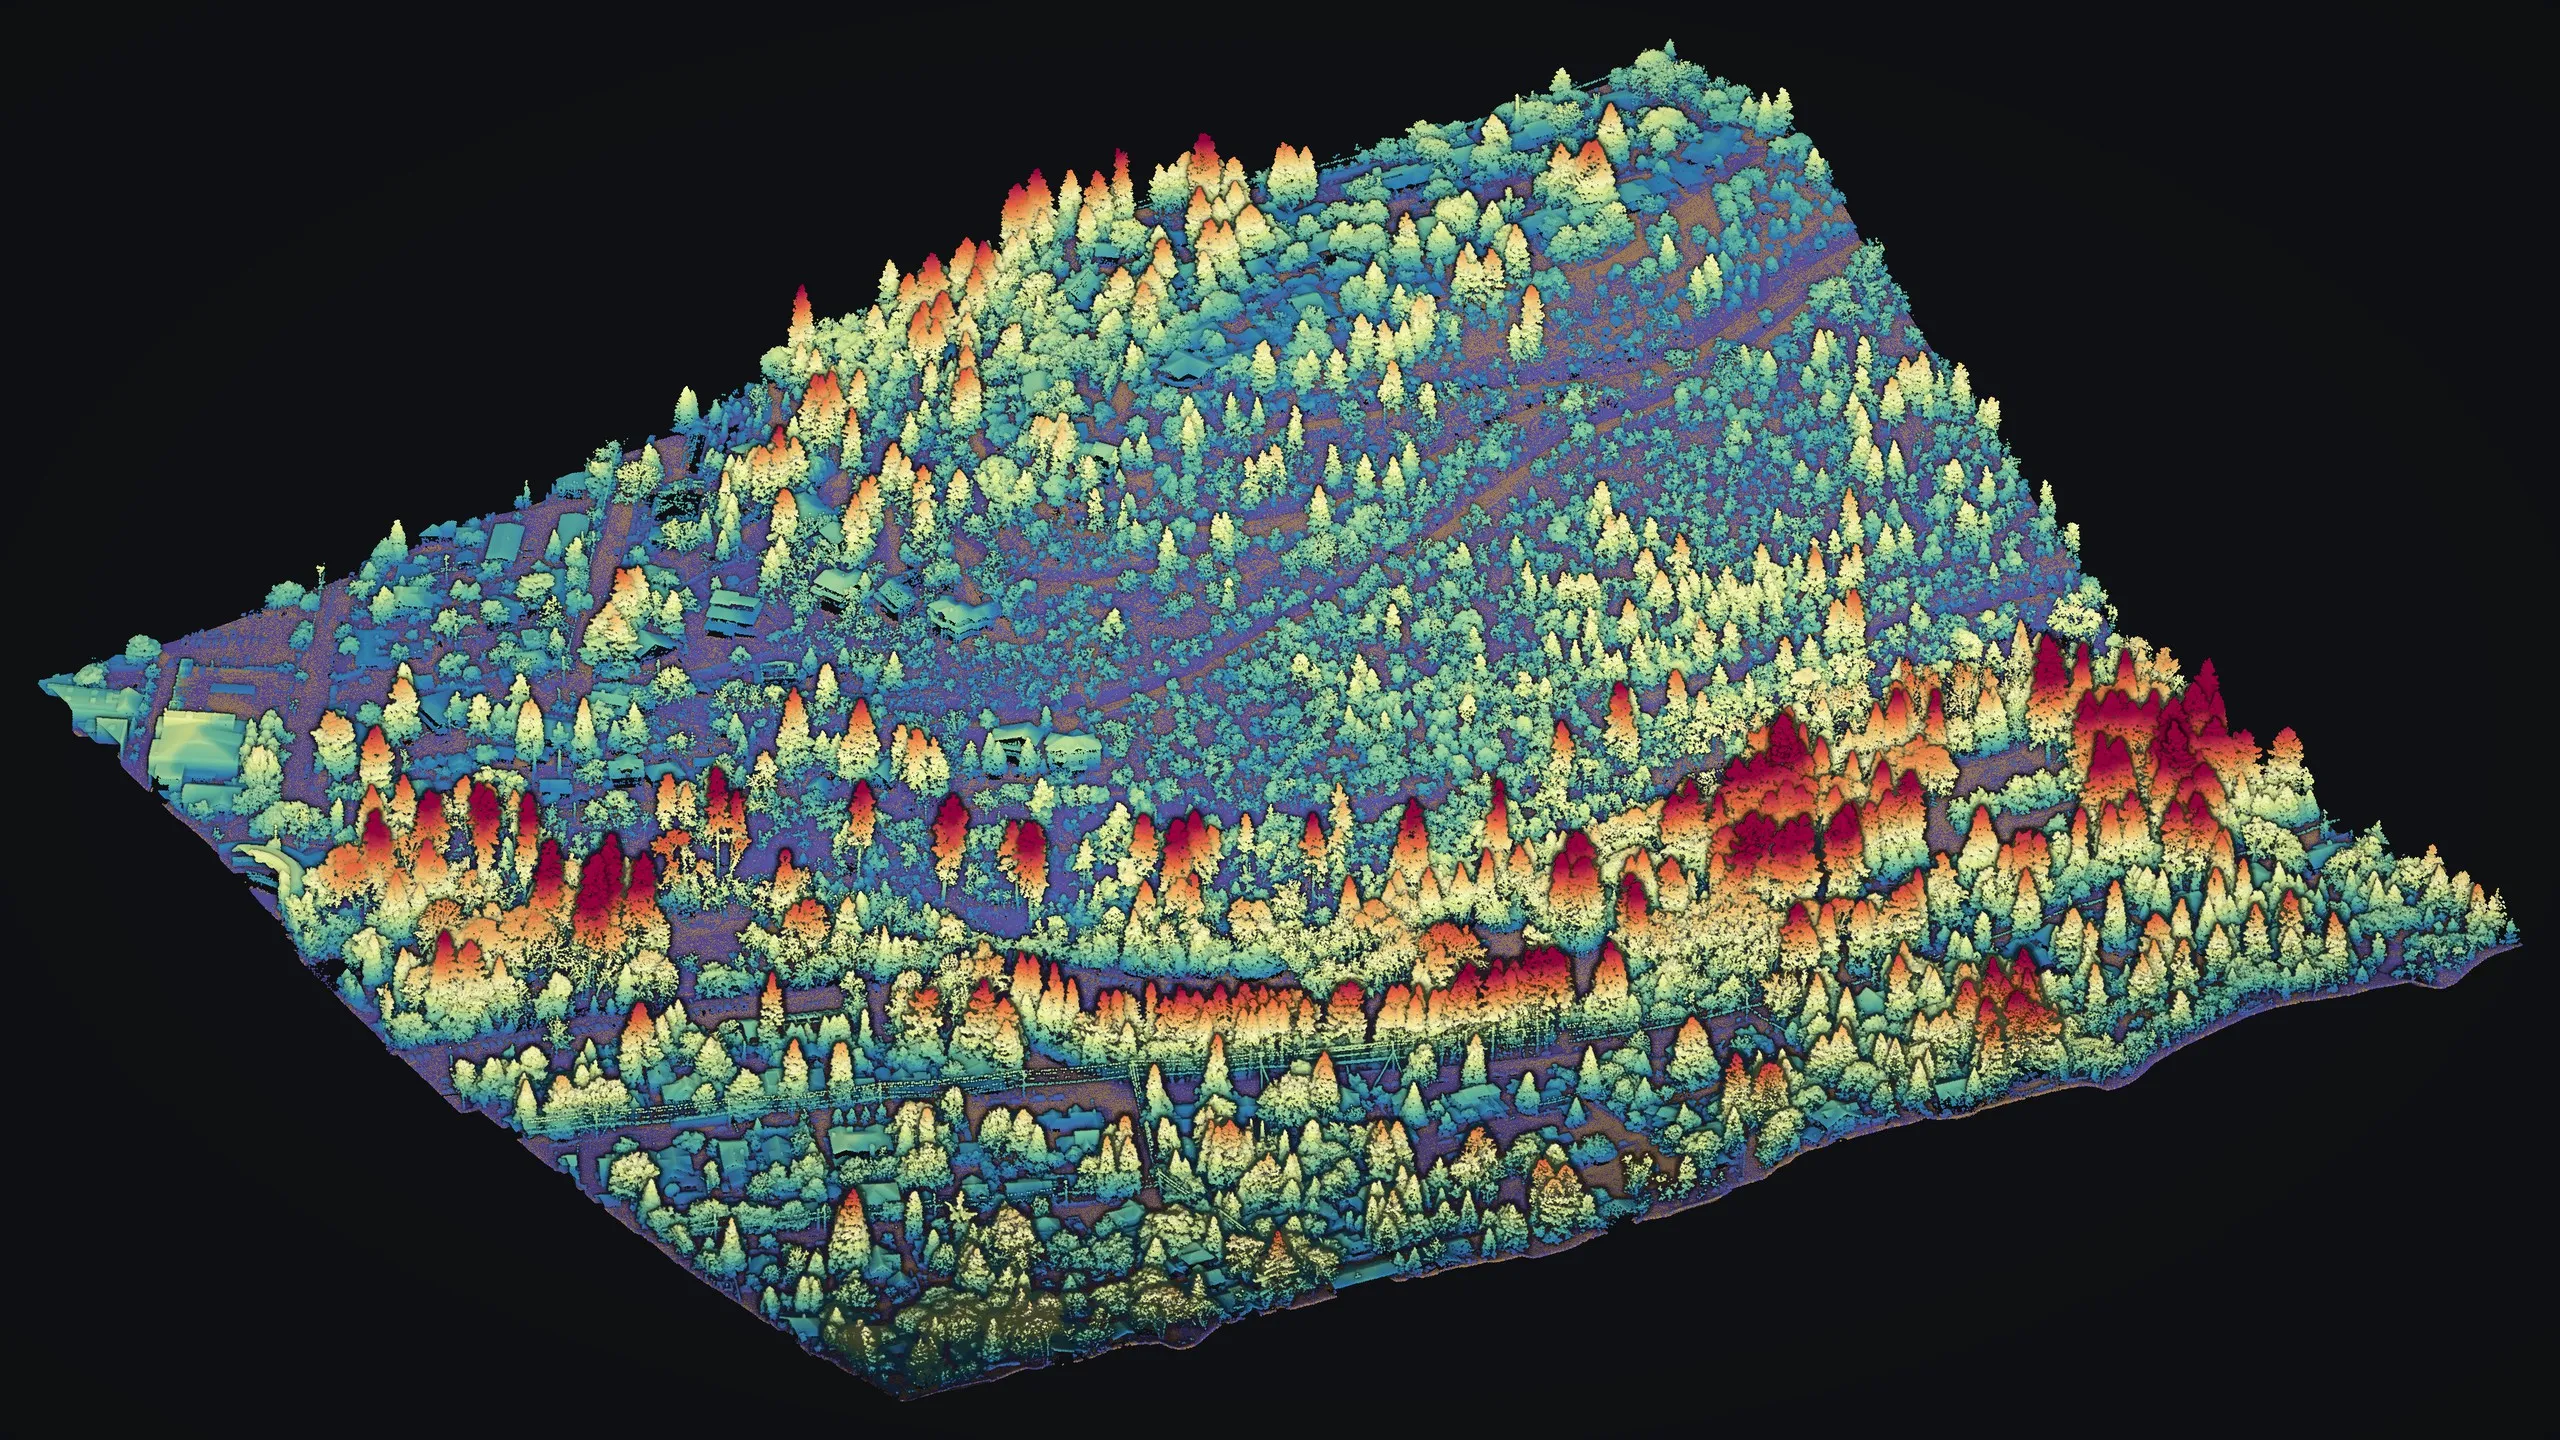
A hundred acres of Ashland, Oregon as a drone LiDAR point cloud seen from above and to one side: every tree a spire coloured by its height, blue and green low, yellow, orange and deep red for the tallest conifers, with houses and streets among them.

Drone LiDAR, every return coloured by its height above the ground Ashland, Oregon, 2024

Fire preparedness

Half the year, the work comes before the fire.

In fire season the Collaborative's pilots map active fires at night. From November to June the same pilots, aircraft and standard go to the ground that has not burned yet: the fuel under the trees, the dead and dying timber, and what stands against each home.

That half is mitigation. We support it, and it needs funding.

What an off season flight makes

Maps of what a fire would burn.

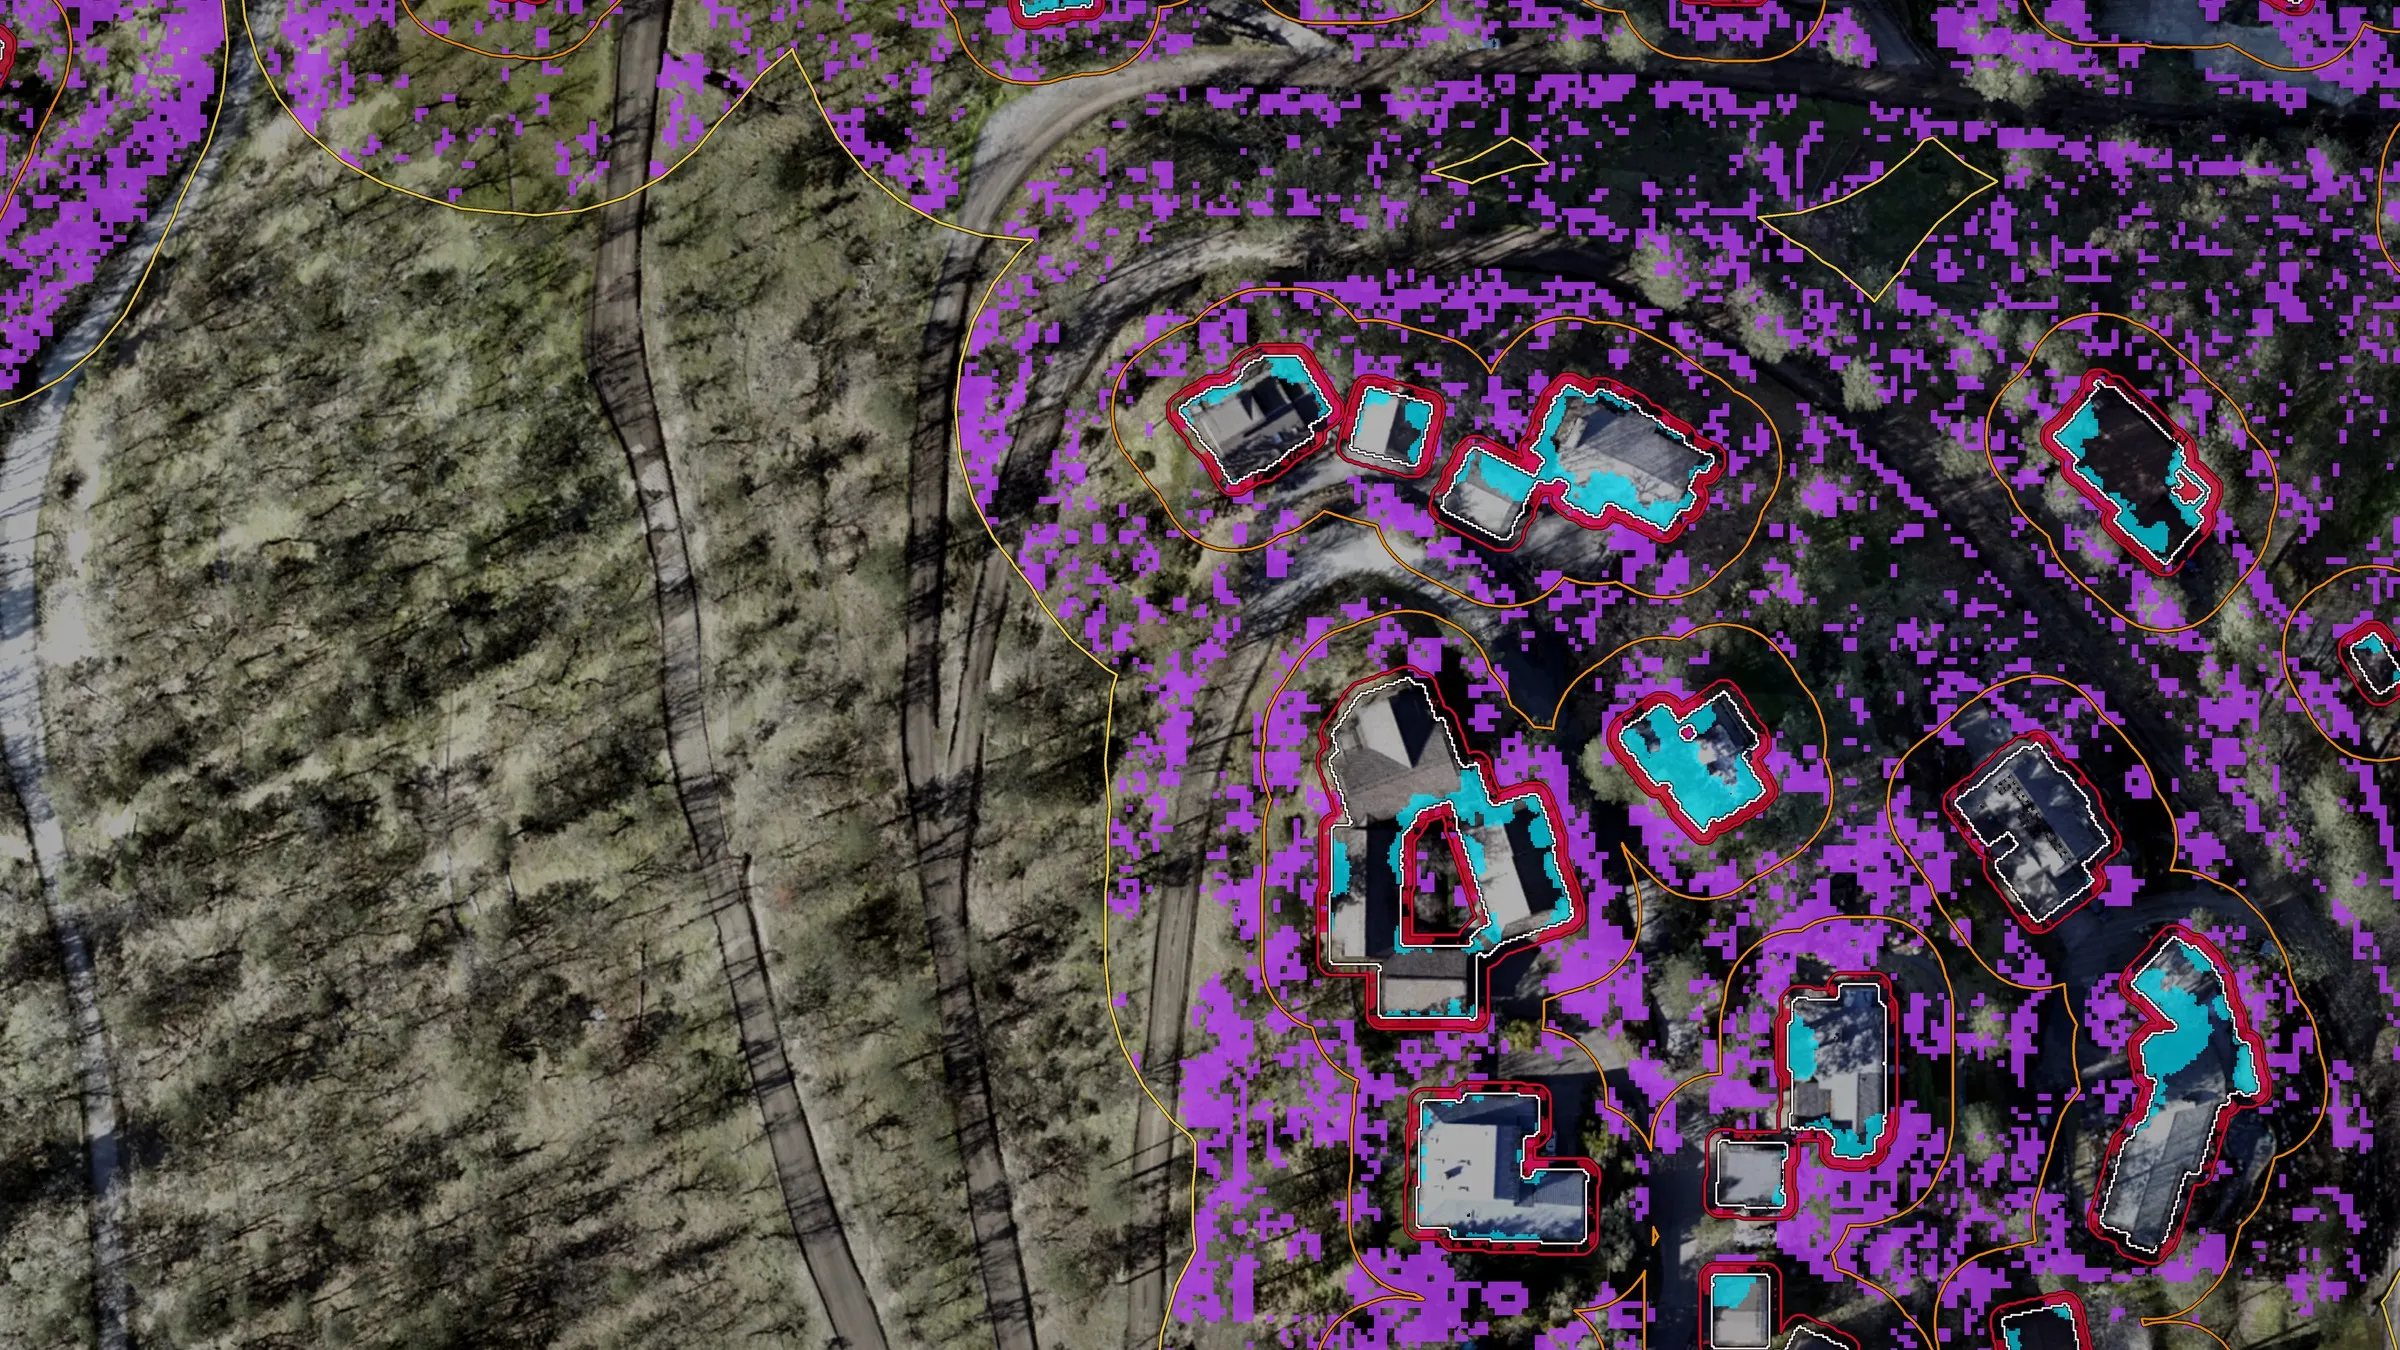
An aerial view of homes on a wooded hillside. Each house is outlined in white inside red, orange and yellow rings. Cyan marks tree canopy over roofs and violet marks low growth under the trees around them.
House by house. Each home sits inside rings at 5, 30 and 100 feet. Red is vegetation against the walls, cyan is tree canopy over the roof, and violet is ladder fuel under the trees.
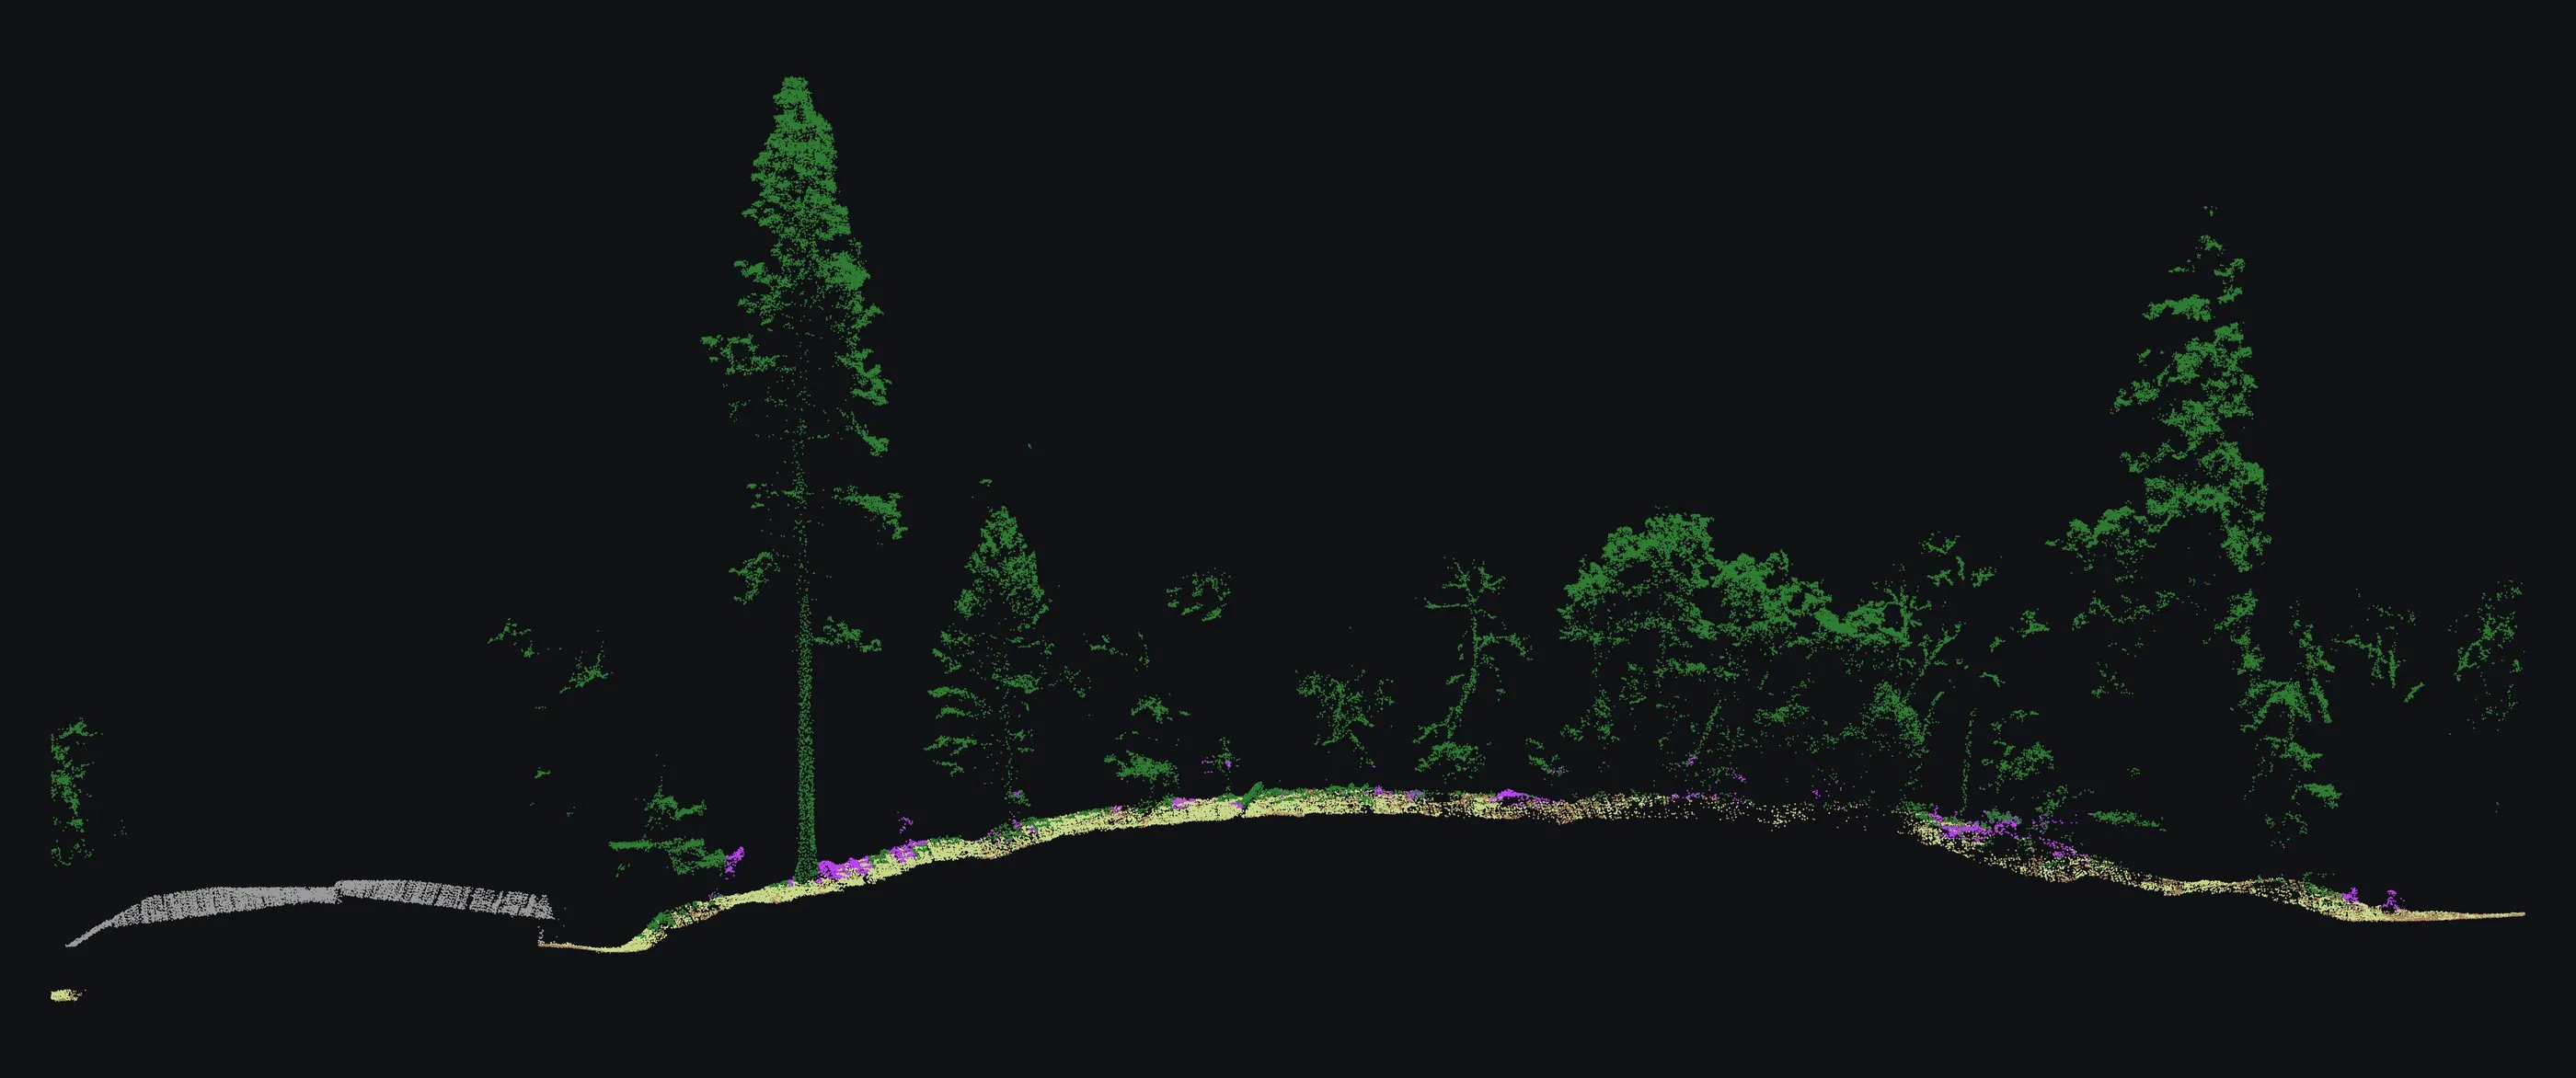
A slice of forest seen from the side, drawn in laser points: a grey roof at the left, green tree crowns on thin stems across a low hill, and small violet clumps of brush under the trees along the ground.
The forest from the side. A six foot slice of laser returns from a home out into the trees, at true scale. The roof is grey, the crowns green, the ladder fuel beneath them violet.
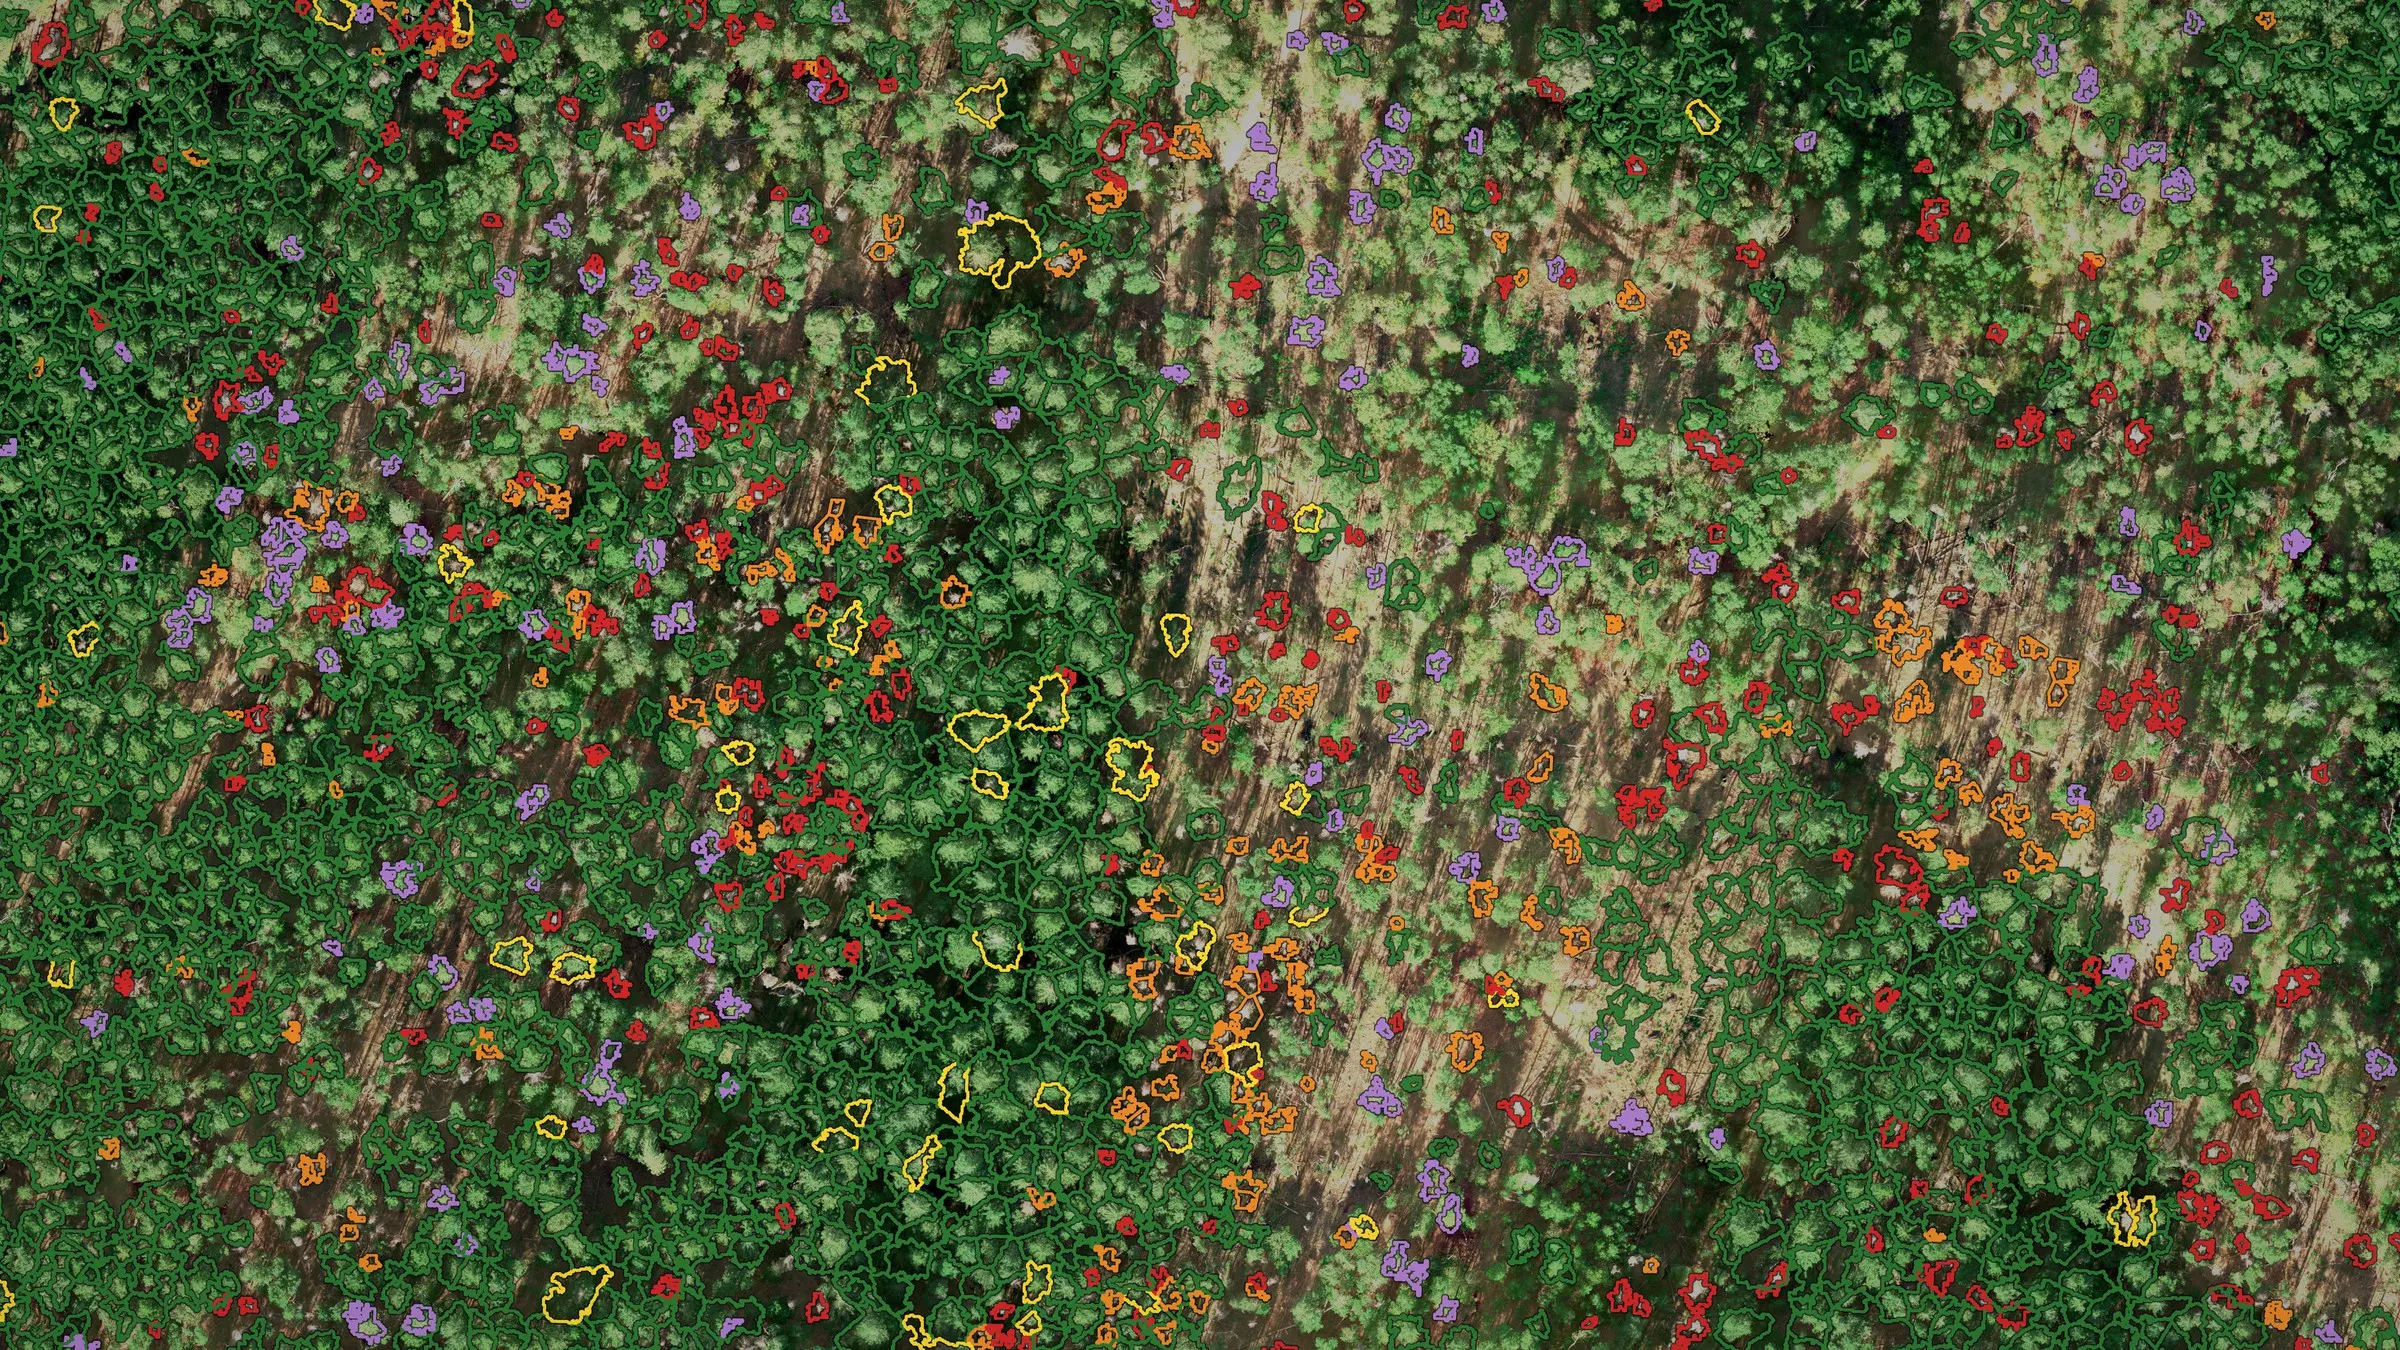
  • Tree crowns outlined in green, yellow, orange, red and lavender over an aerial photograph of forest, one outline per tree.
    Every tree, by health. Douglas fir crowns outlined by class: green for a healthy crown, yellow for one in decline, orange for dieback and red for dead. Ponderosa pine is lavender.
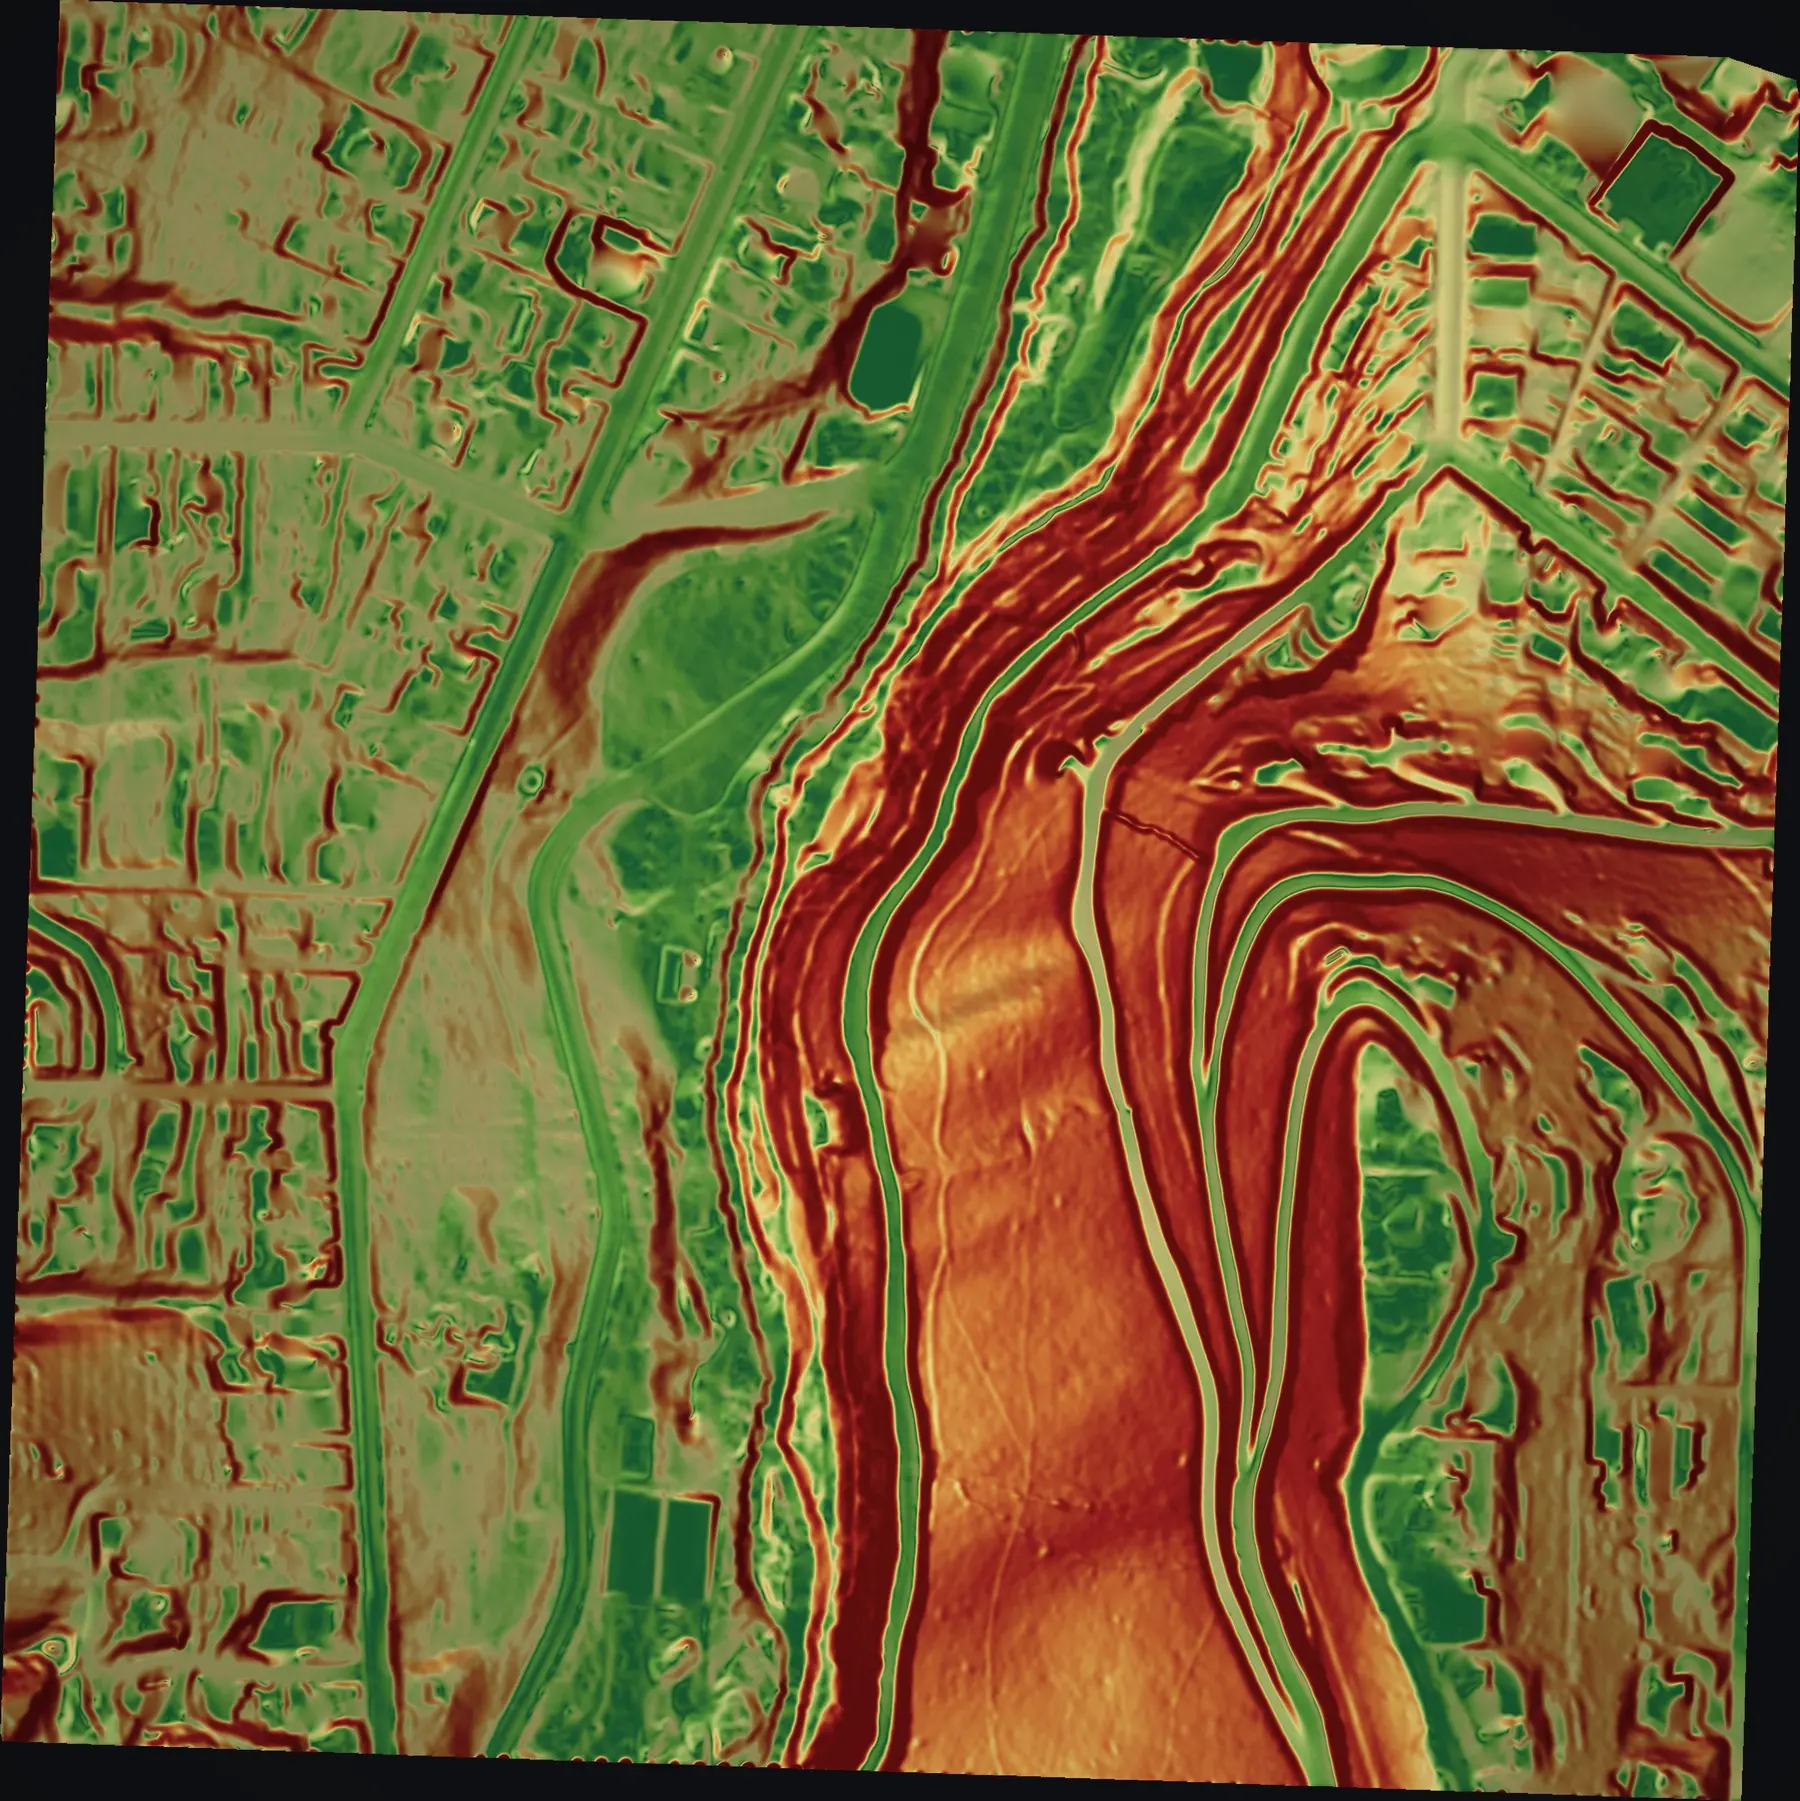
  • A slope map of a neighborhood and the ravine through it: streets and lots in green, the ravine walls in orange and dark red.
    The ground under the trees. Slope measured from the bare earth beneath the canopy, green gentle to dark red steep. Fire runs uphill faster.
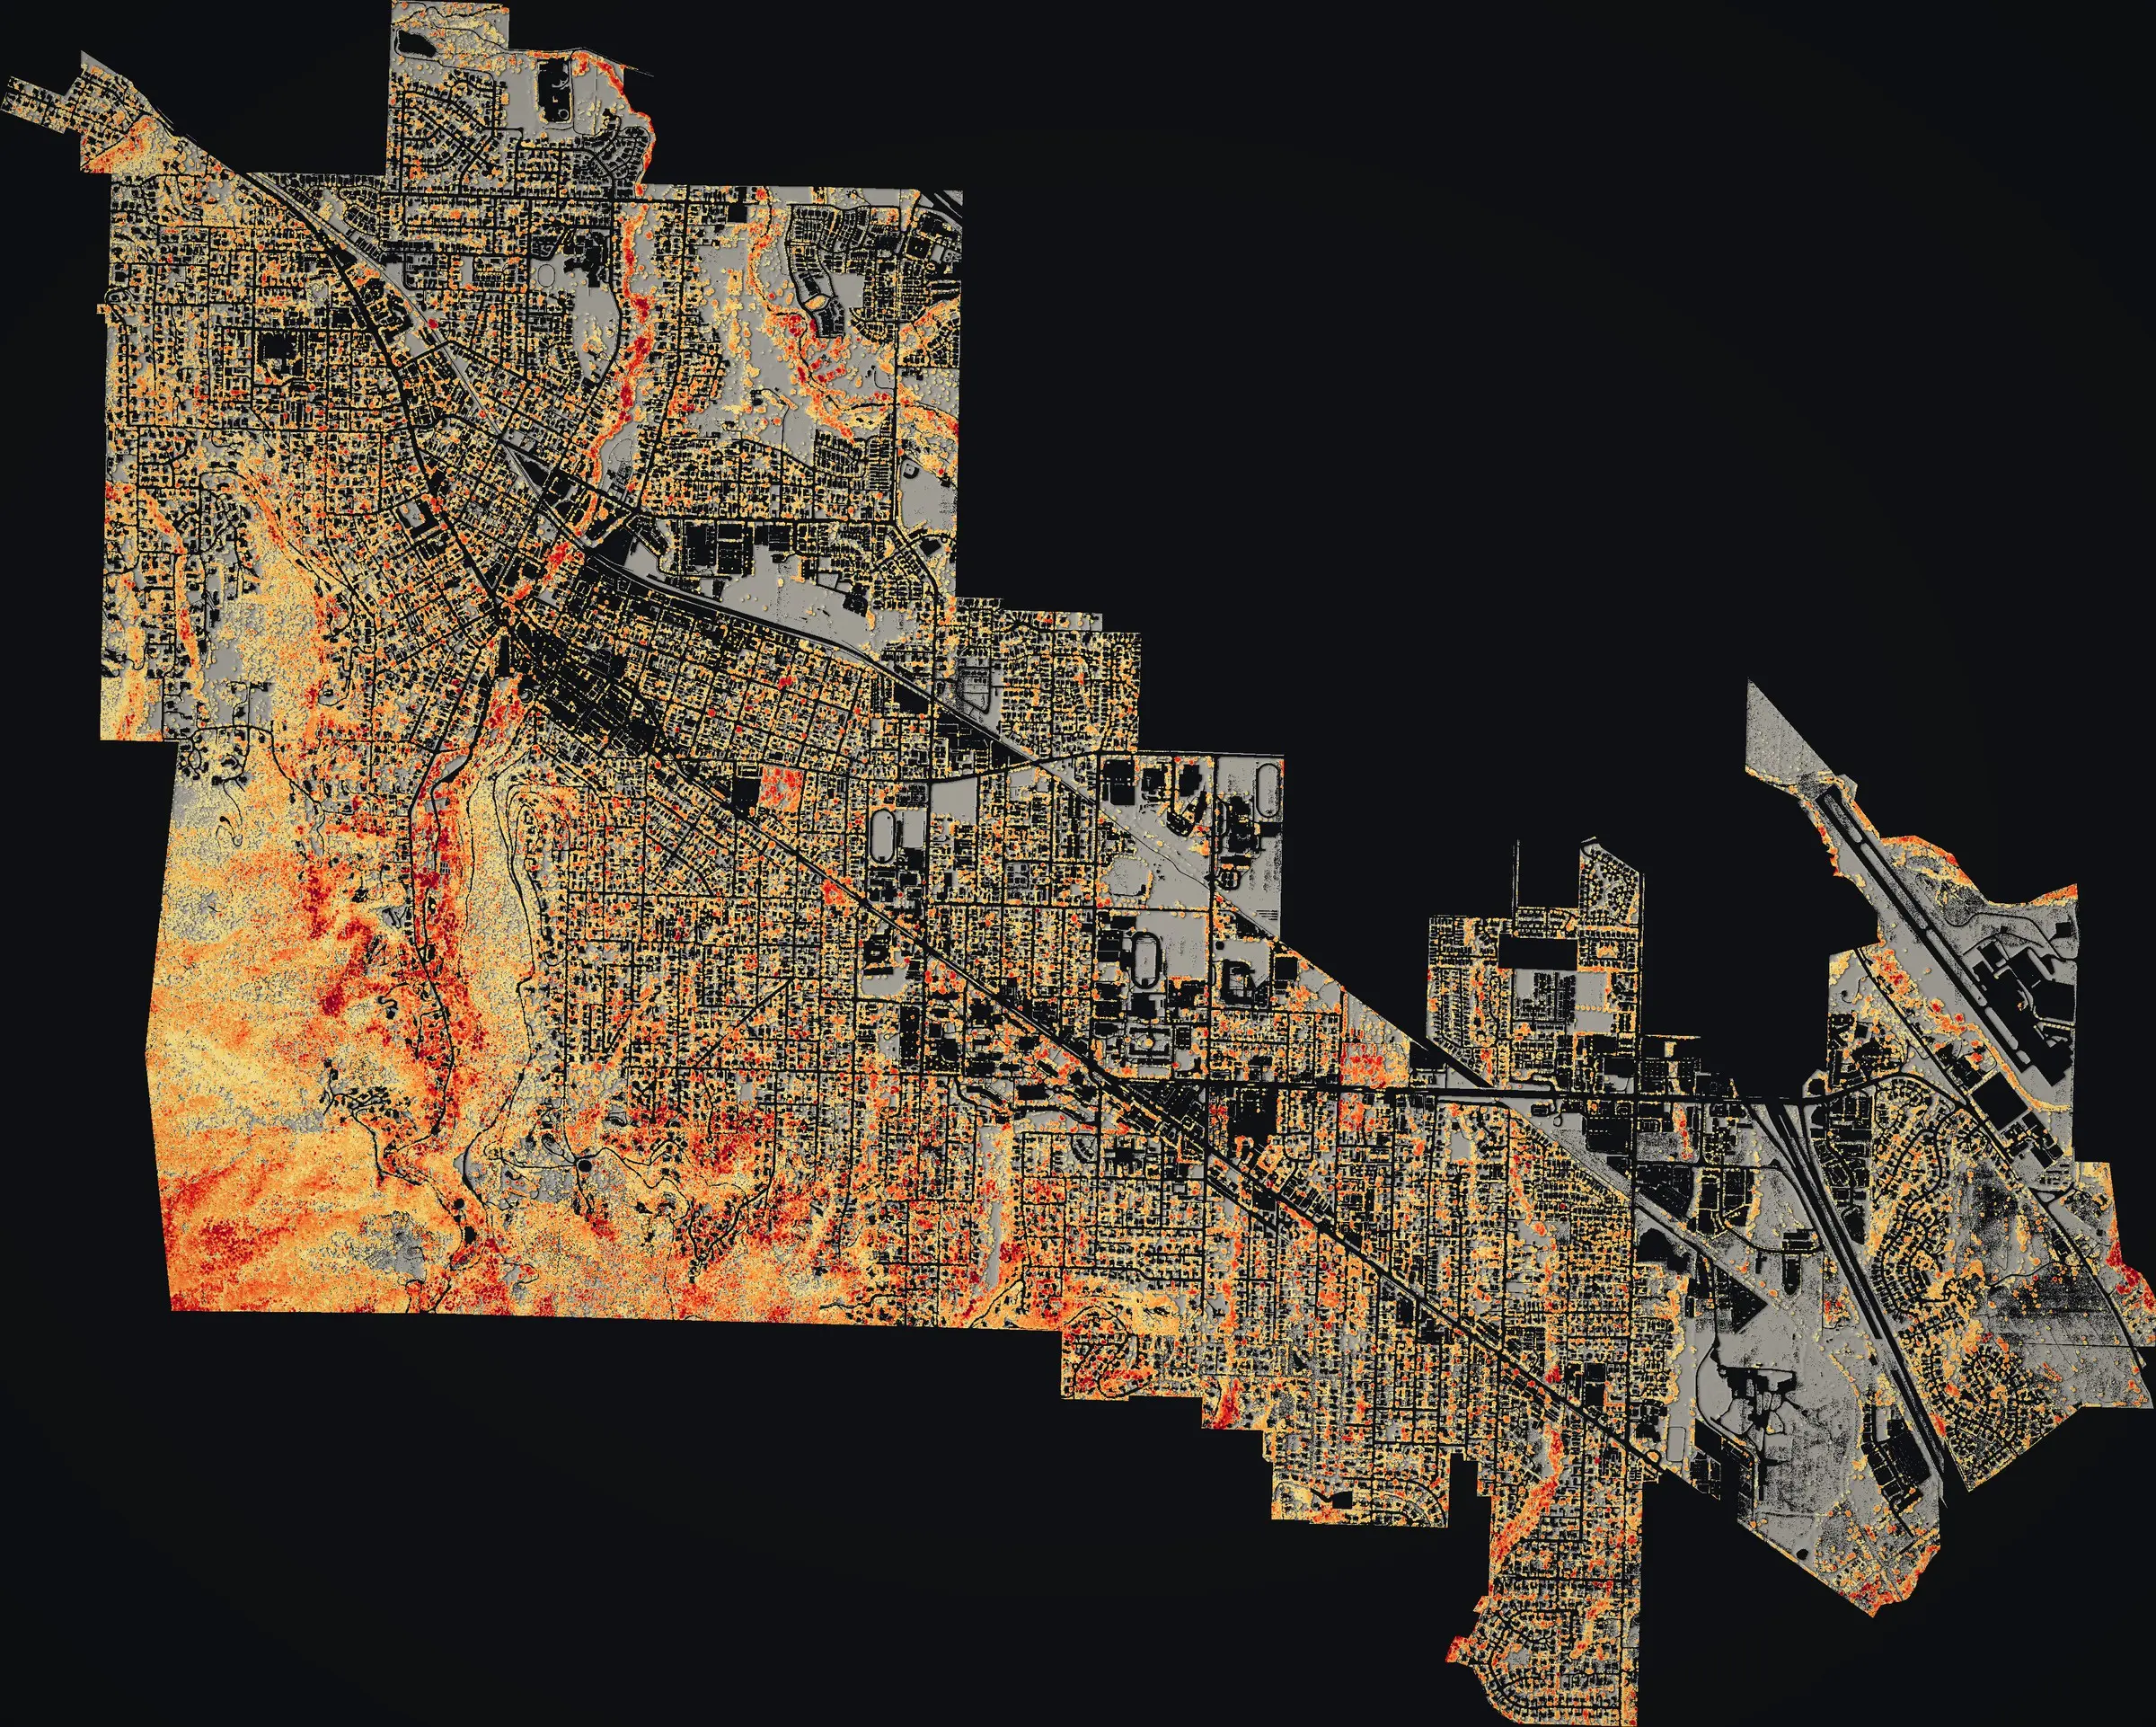
  • A canopy height map of the whole city of Ashland on a dark ground, the forested south and west edges in orange and red.
    A whole city's canopy. Ashland's tree and brush height from all 52 sections of the 2024 flight, pale yellow low to dark red tall.

Every picture on this page was flown for Ashland, Oregon, by Rogue Reconnaissance, the founder's company, in 2023 and 2024.

One roster, two seasons

The same pilots, on both sides of the fire.

Fire season July to October

Active fires, mapped at night

The heat perimeter and the heat sources inside and around it, from drone infrared, for incident commanders, crews and agency GIS.

In 2026: 11 fires and 146 approved map sets.
The 2026 case studies

Off season November to June

The fuel around communities, mapped before it burns

Fuel under the canopy, dead and dying trees, and what touches each home, from drone LiDAR, a multispectral camera and colour imagery. For cities writing a wildfire protection plan, fire districts, land managers and homeowners.

Proven in Ashland, Oregon, 2023 to 2025.

The Ashland work

Why it takes a scan

The fire question a photograph cannot answer.

A fire moving along the ground reaches the treetops only if something lifts it there. Brush, young trees and low branches do the lifting, and firefighters call them ladder fuel.

Seen from overhead, closed canopy looks alike whether the space beneath is clear or choked. LiDAR is a laser scanner carried on the drone. Its pulses slip through the gaps and record every layer on the way down, so the stack can be read: how tall, how dense, and how near a home.

A Community Wildfire Protection Plan must show where fuel sits against homes, lot by lot. This is the measurement that lets it.
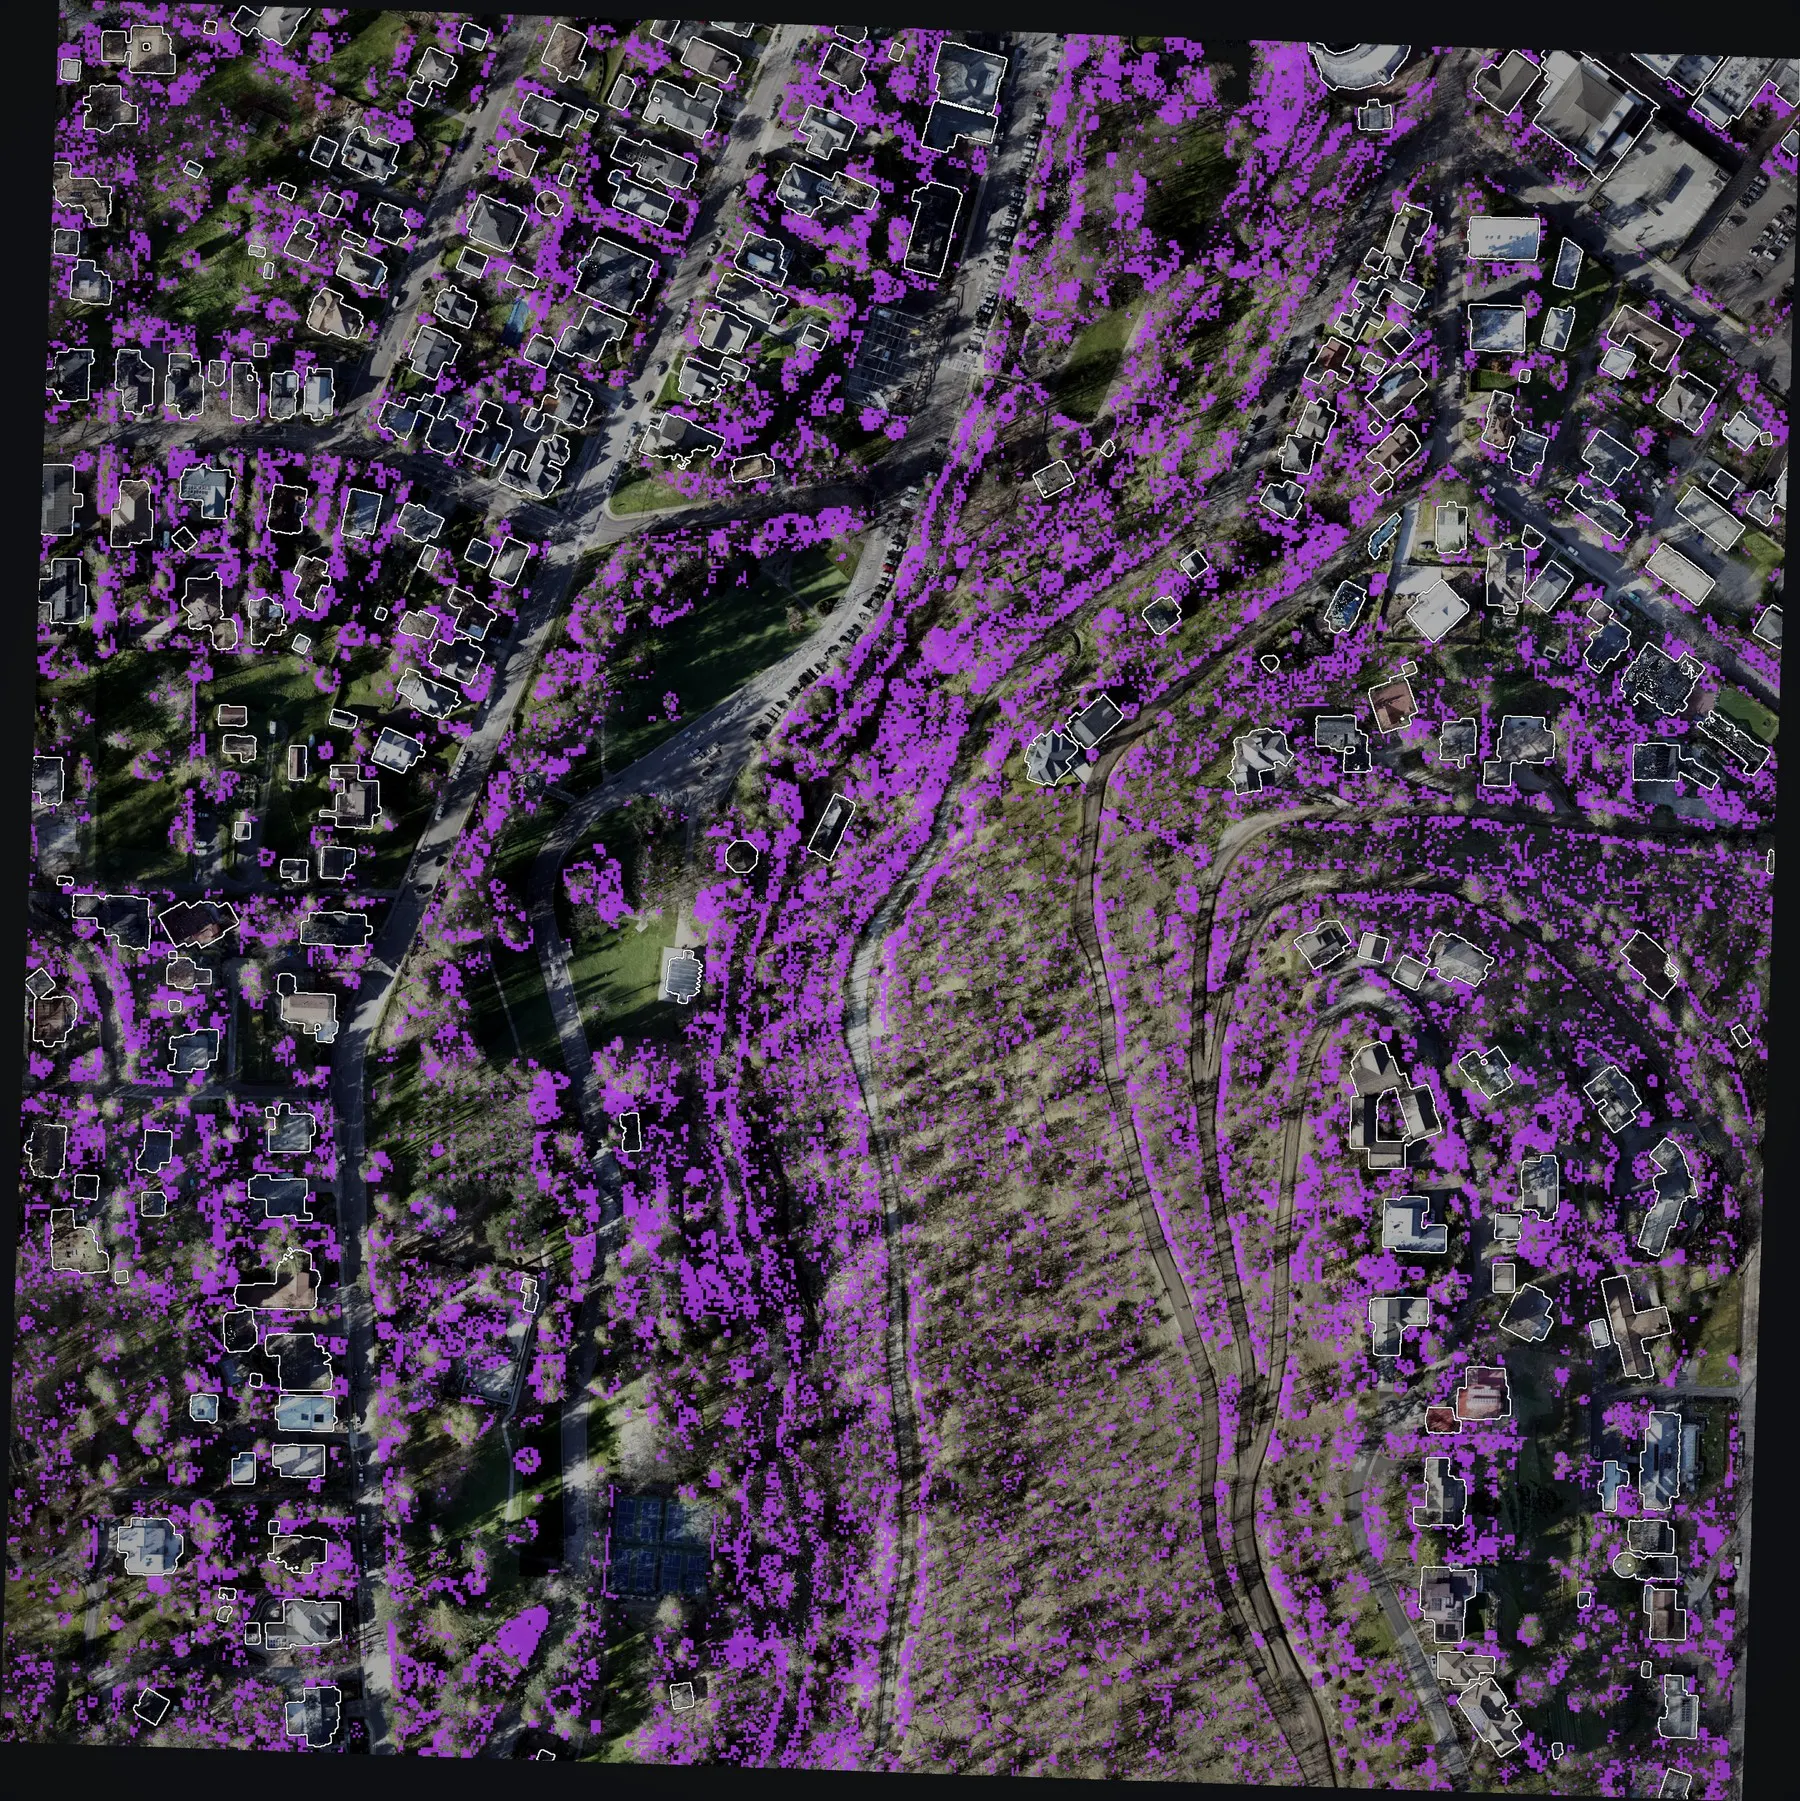
An aerial view of a hundred acres of homes and wooded ravine with violet patches wherever low growth sits beneath tree canopy, thickest along the ravine and between the houses.
Ladder fuel in violet: growth 1 to 8 feet tall that the laser found beneath a tree crown. About 16 of this section's 100 acres.

Delivered Ashland, Oregon, 2024

A whole city, flown for its wildfire plan.

In 2024 the City of Ashland had the whole town flown with drone LiDAR for its Community Wildfire Protection Plan, paid for from a Community Wildfire Defense Grant. The plan the city published in 2025 draws three measures for every structure from that data, and uses it to map how closely buildings are packed.
4,300
Acres flown. In 100 acre sections, 250 feet above the ground, in roughly two and a half weeks.
3
Measures for every structure. Vegetation within five feet, ladder fuel around it, and canopy over the roof.
2025
The plan, accepted. The City Council accepted it unanimously on August 19, 2025.
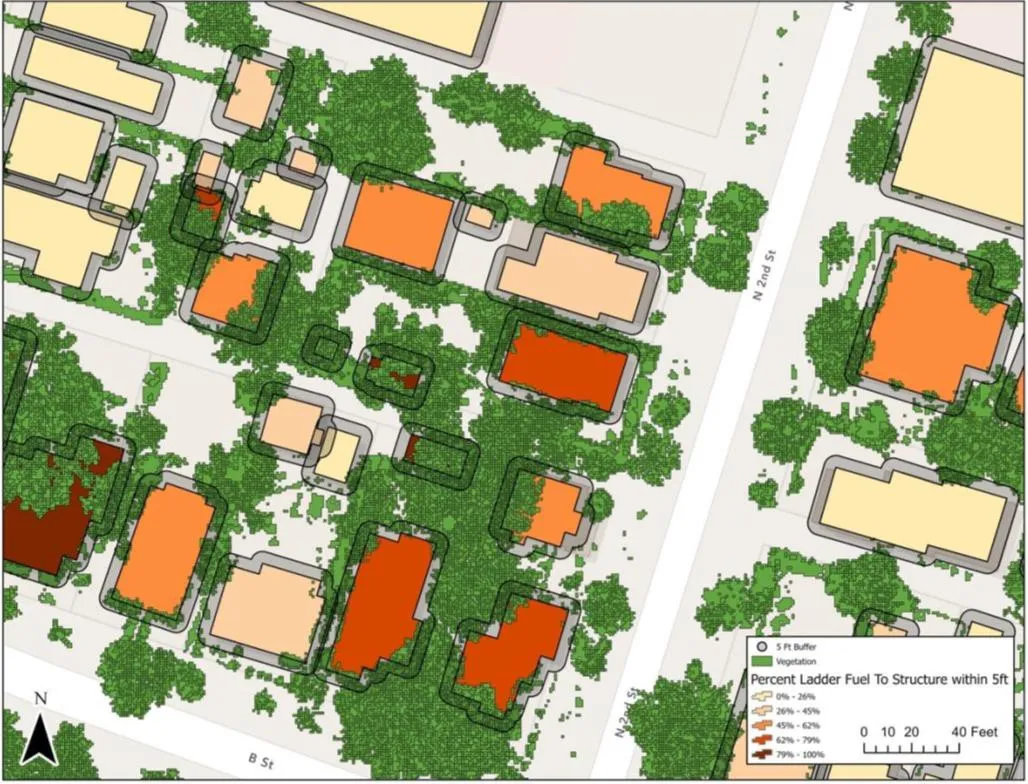
  • A map of a few city blocks from the Ashland plan: each building shaded from pale orange to dark red by the share of vegetation within five feet of it.

    Fuels within five feet

    Figure 13. How much of the five foot zone around each structure is vegetation.
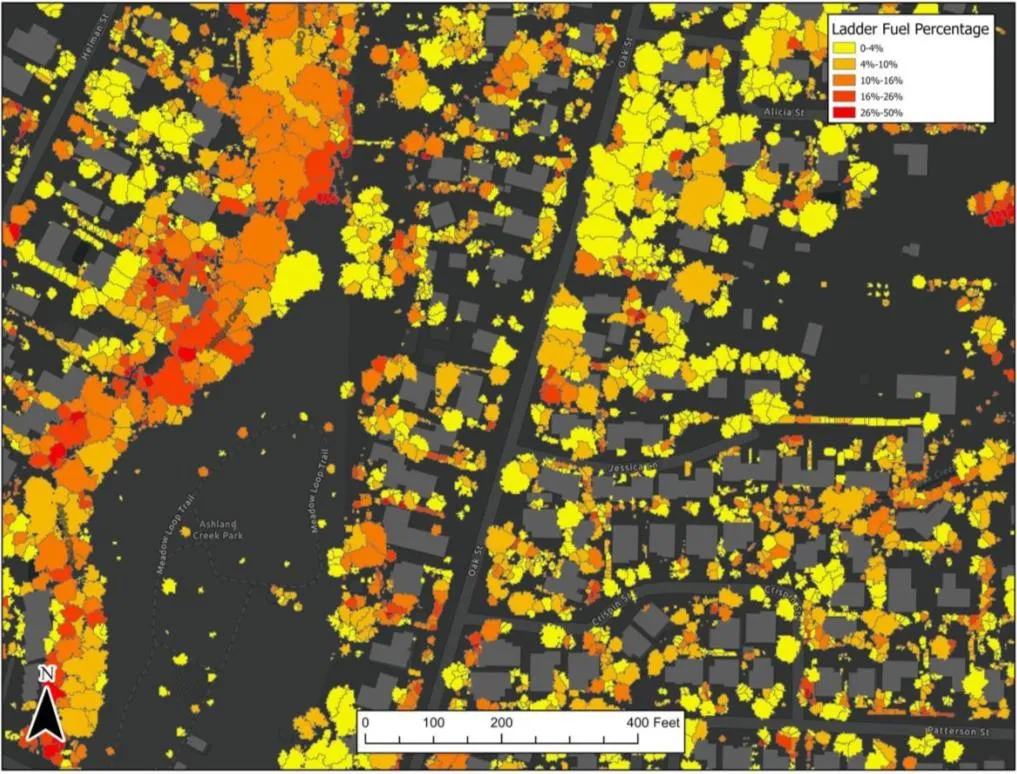
  • A map from the Ashland plan on a dark ground: tree crowns coloured yellow, orange and red by ladder fuel share, with buildings in grey.

    Ladder fuel around structures

    Figure 14. The share of ladder fuel in each tree crown, yellow low to red high.
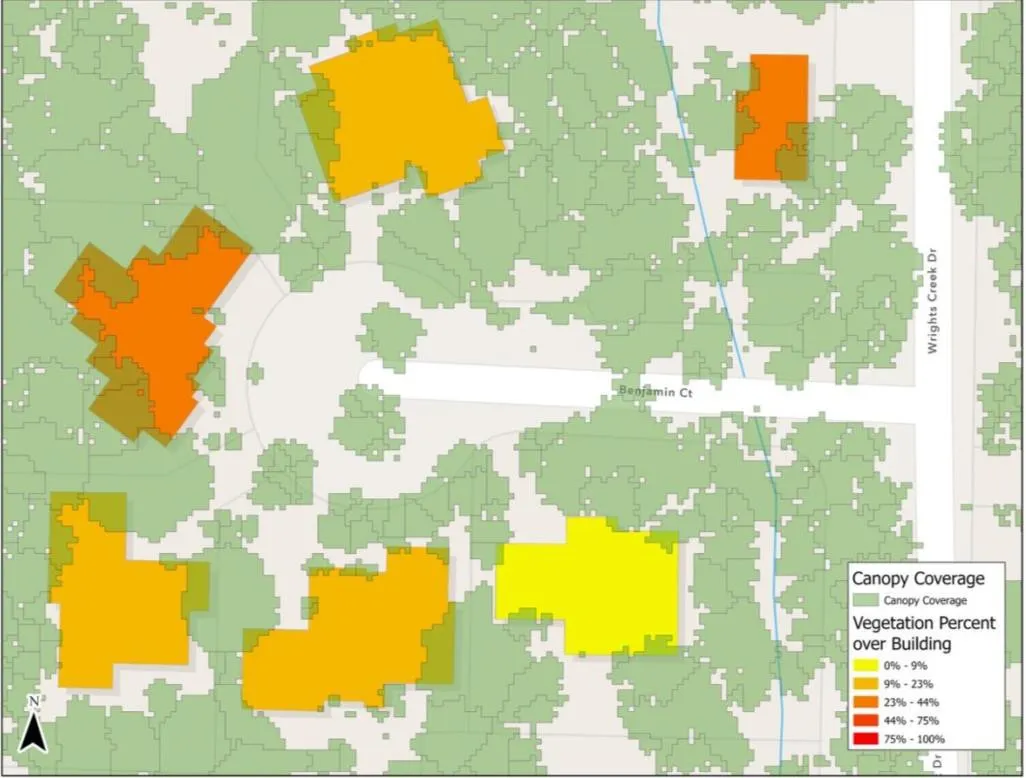
  • A map from the Ashland plan: tree canopy in pale green with five buildings shaded yellow to orange by how much canopy covers the roof.

    Canopy over structures

    Figure 15. How much of each roof sits under tree canopy.

Figures from Ashland's Community Wildfire Protection Plan of 2025, pages 73 to 75, published by the city. The flight and its data were the work of Rogue Reconnaissance, the founder's company, under contract to the city. The plan names it as the aerial LiDAR contractor.

Delivered Ashland watershed, 2023 and 2024

Thirty thousand Douglas fir, counted twice.

Across the forest the city owns above town, Douglas fir was dying. Two drone surveys, a year apart, put a number on it: one before the city's helicopter logging and one after.
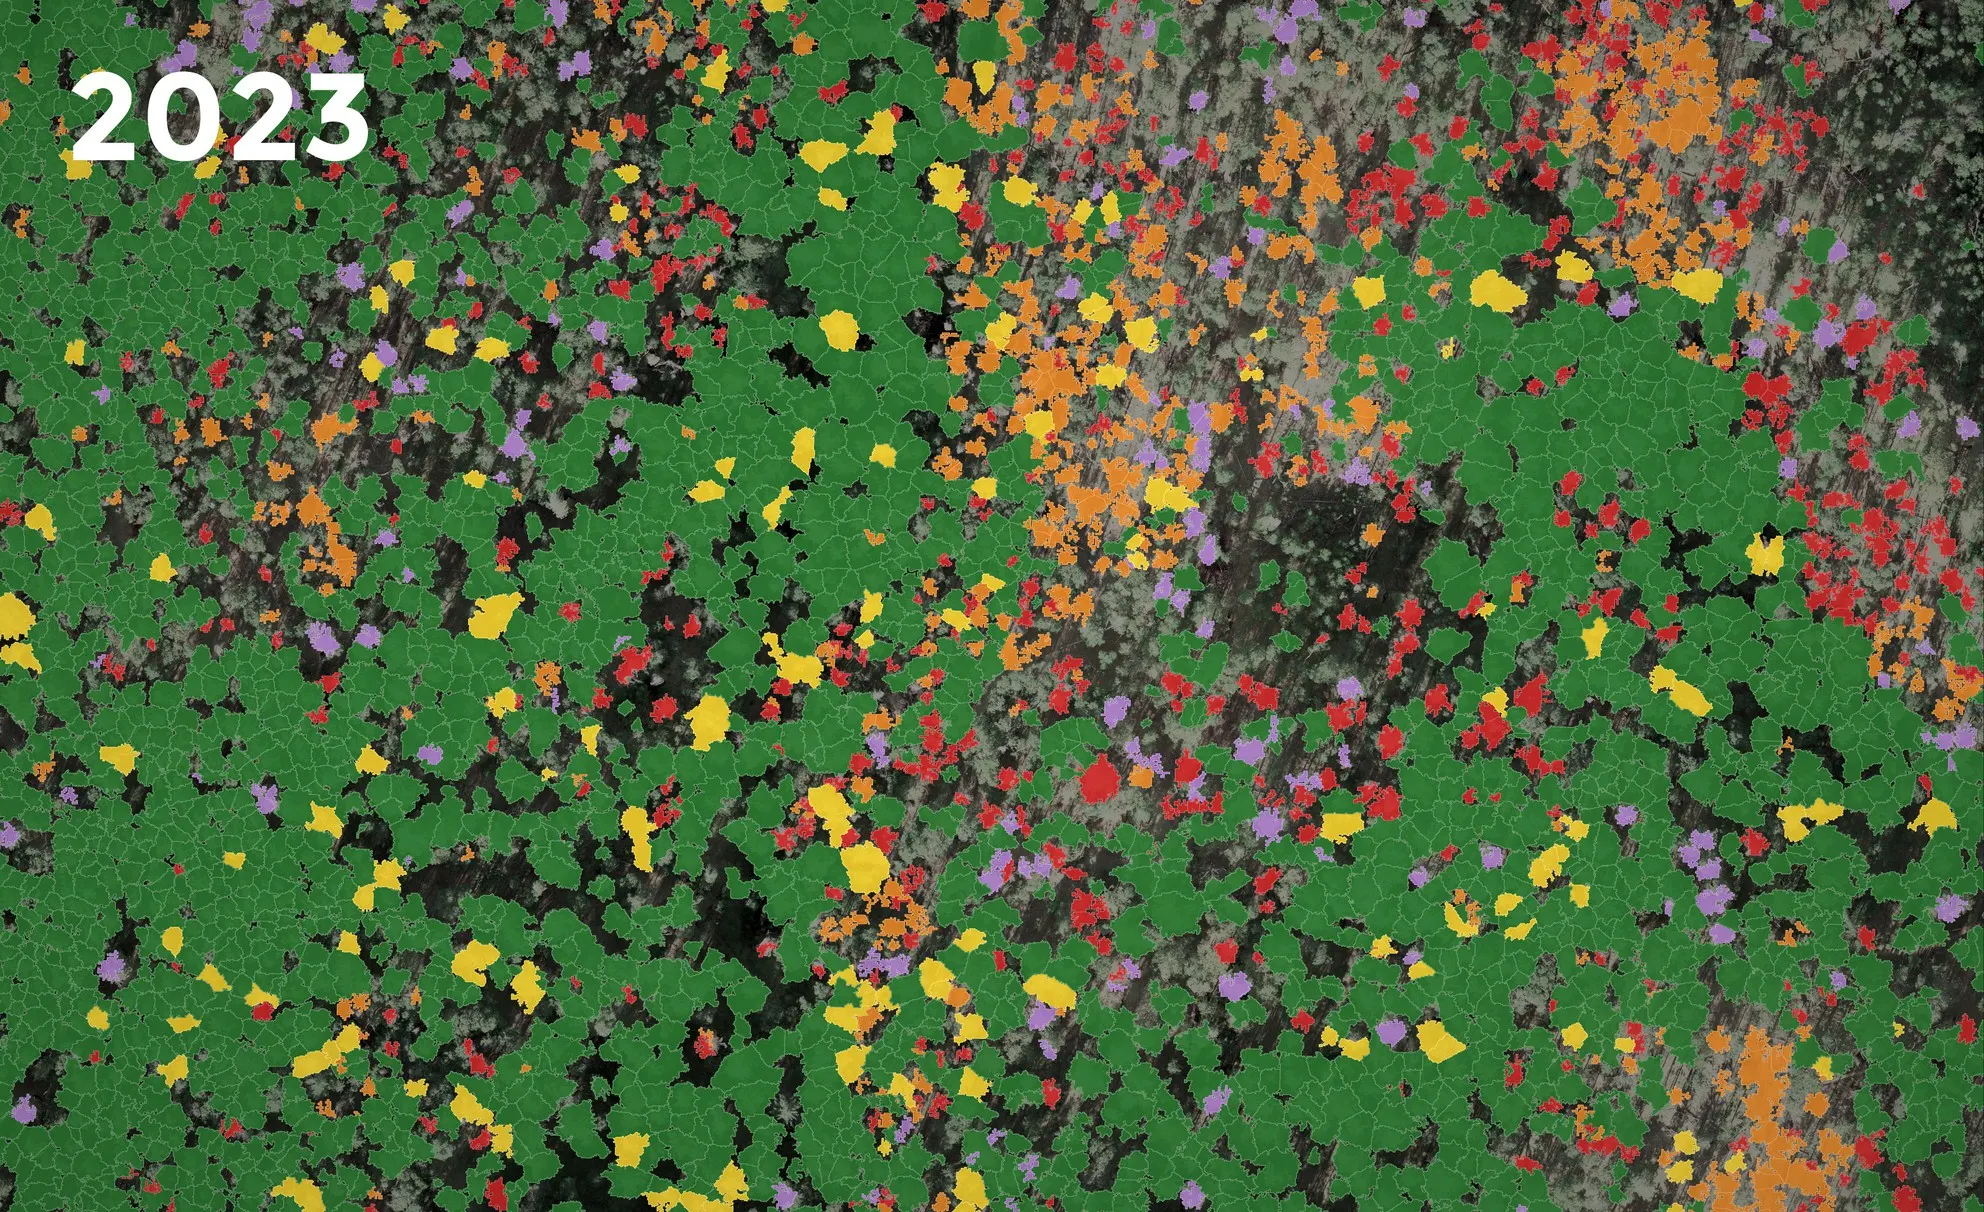
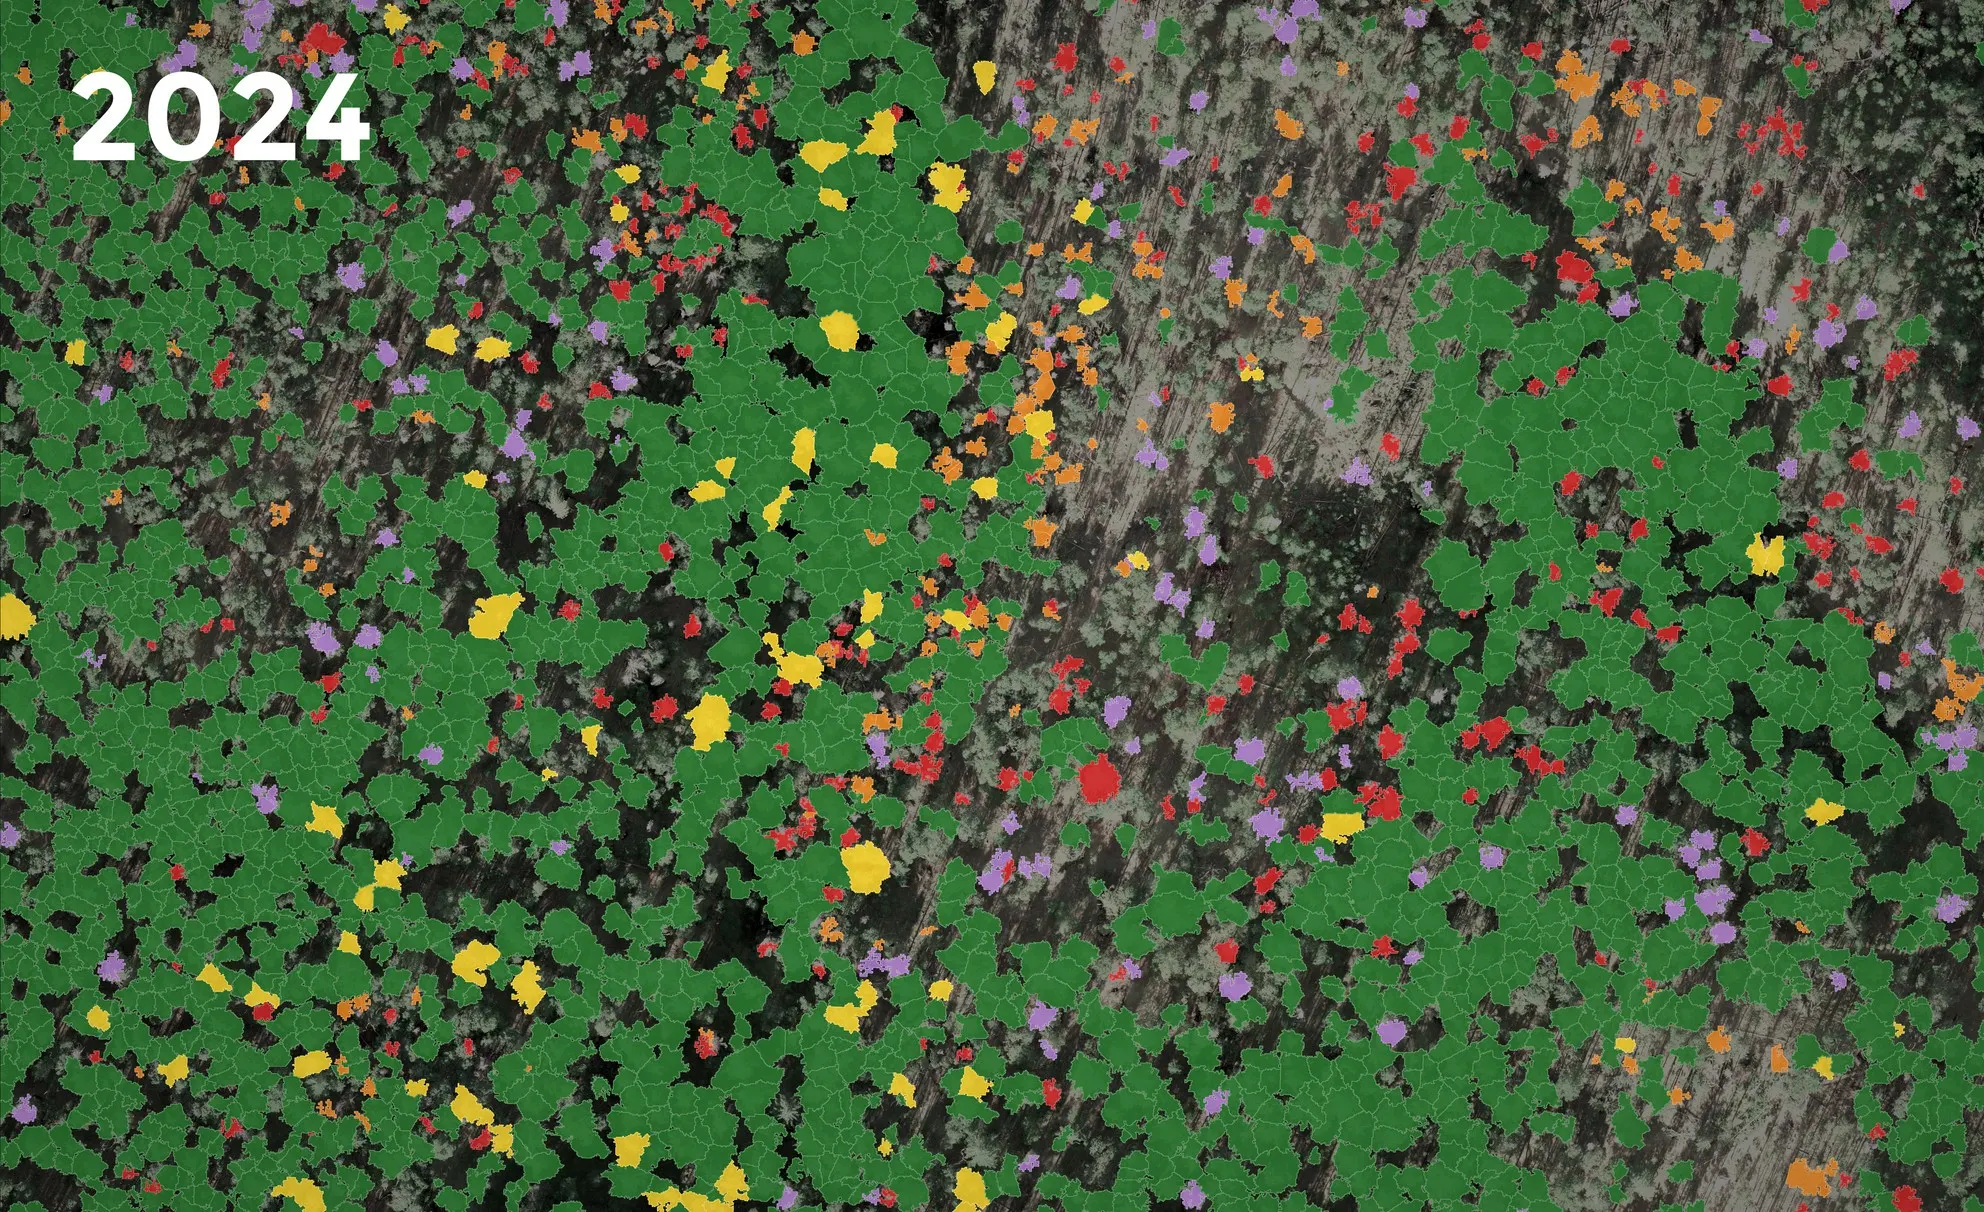
A block of forest in 2023 with every tree crown filled by health class: mostly green, with large patches of orange and red where Douglas fir was dying or dead. The same block of forest in 2024: most of the orange and red crowns are gone and bare ground shows where they stood.
Siskiyou Mountain Park, before and after. Every Douglas fir crown filled by its class, from green for healthy through yellow and orange to red for dead. Nearly 1,300 dead in 2023. After the removals, 643 still standing in 2024.

June 2023 before

About one in five, dead or dying

More than 27,000 Douglas fir, each one classed by health from LiDAR and a multispectral camera. About one in five was dead, in dieback or declining. The city published the report and planned around it.

October 2024 after

What was left standing

In spring 2024 the city took dead and dying trees out by helicopter. The second survey counted 30,226 Douglas fir across 879 acres: 1,997 dead, 817 in dieback and 454 declining. It covered different ground than the first, so the park above is the like for like comparison.

Why it is a fire question

A dead tree counts twice

Beside a road or a trail it is a hazard before any fire arrives, and when one does, dry standing timber is fuel. A count by class tells a city where to send a crew first.

Both surveys were flown and classed by Rogue Reconnaissance, the founder's company, for the city.

What a community gets

One flight, six kinds of answer.

Three sensors feed all of it: LiDAR for structure, a multispectral camera for tree health, and high resolution colour for the picture underneath.

  • Fuels data for a wildfire plan

    Ladder fuel, the five foot zone and canopy over the roof, for every structure.

  • Dead and dying tree counts

    Every crown classed by health, with the tally for each management unit.

  • Hazard trees

    Standing dead timber beside roads and trails.

  • A house by house map

    Each home inside its 5, 30 and 100 foot zones: what touches the wall and what hangs over the roof.

  • Terrain

    Bare earth, slope and contours. The steep ground below a home is part of its exposure.

  • Prescribed fire

    Fuels and terrain before the burn, drone infrared during and after it.
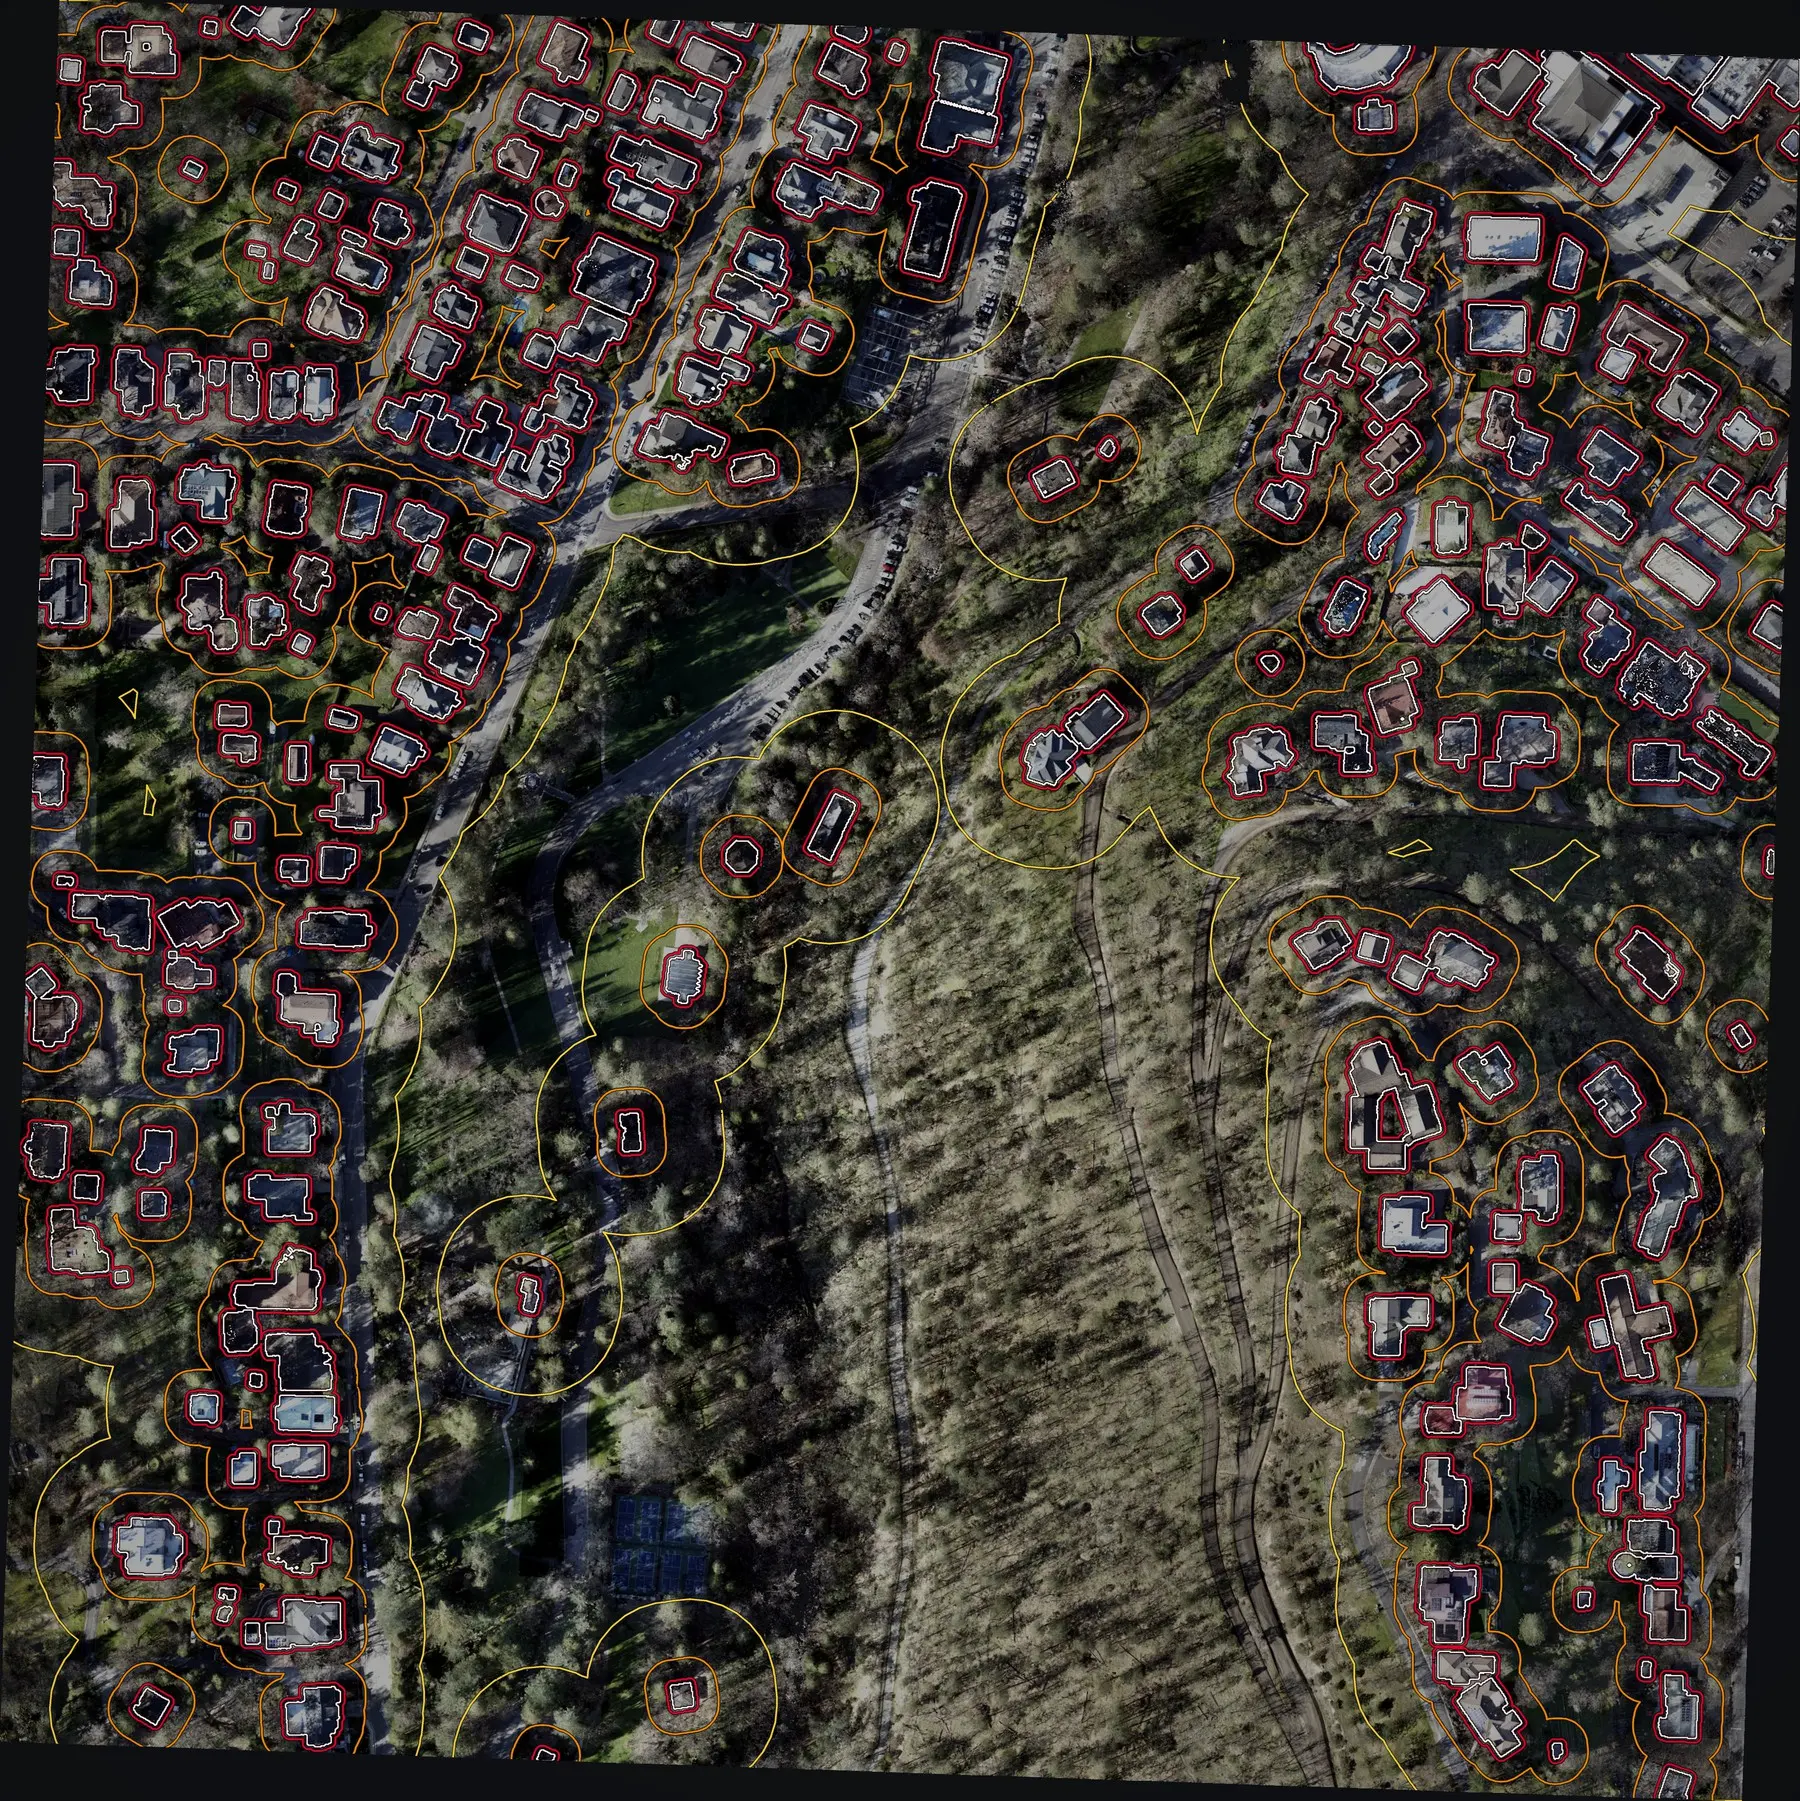
An aerial view of a hundred acres of homes and a wooded ravine. Every building is outlined in white and ringed in red, orange and yellow at increasing distances.
The zones round the 232 buildings the laser found on one 100 acre section: 5 feet in red, 30 feet in orange, 100 feet in yellow.
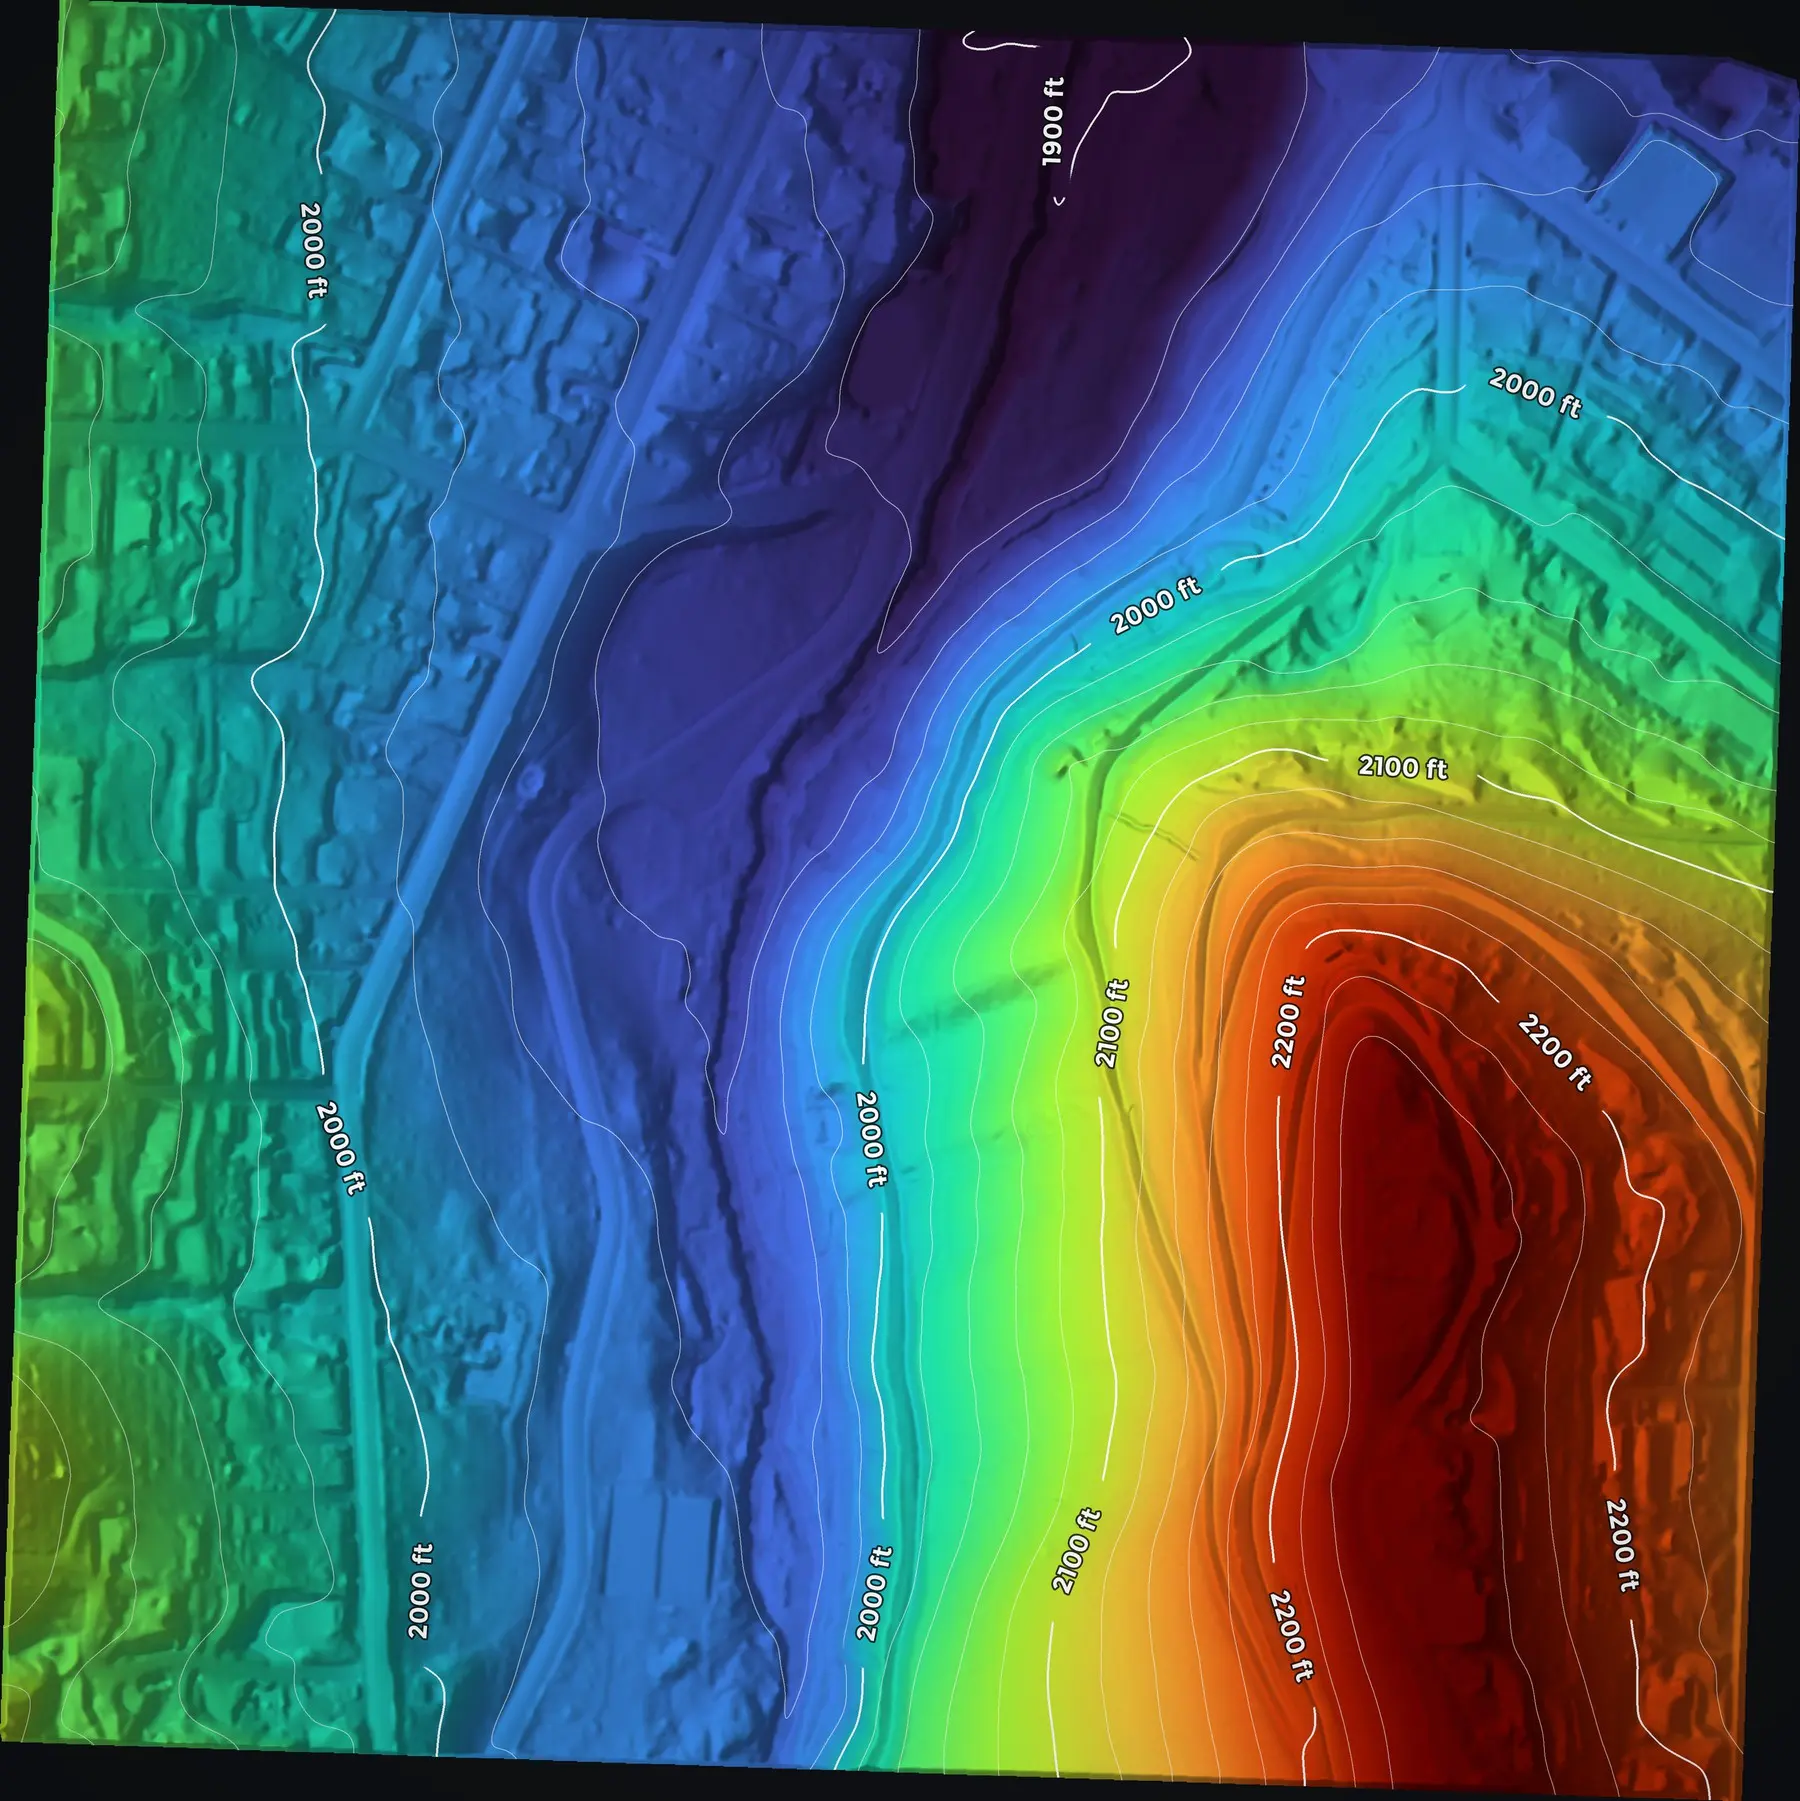
The same hundred acres with every tree and roof removed: bare ground shaded from blue in the ravine to red on the ridge, with contour lines and elevation labels.
The same section with every tree and roof taken away: the bare earth under the canopy, contoured every 20 feet.

Who it is for

A city or county writing or revising its wildfire protection plan
Fuels and structure exposure, parcel by parcel, as figures the plan can print
Fire districts and Oregon Department of Forestry districts planning fuels work
Ladder fuel and slope by block, to decide where to treat first
Watershed, parks and public lands managers
Dead and dying tree counts by unit, and hazard trees beside roads and trails
Homeowners and neighborhood Firewise groups
A map of their own lot: what touches the house and what hangs over the roof
Tribes
The same maps of their own lands, delivered into their own GIS
Prescribed burn associations
The unit before the burn, and the burn mapped during and after

Delivered into the community's own GIS, in formats its staff already use: printable map sheets, GIS layers and Google Earth files.

Why it needs funding

A small town cannot buy this on its own.

Flying a whole community with LiDAR costs more than most small towns, fire districts and neighborhood groups can find. Ashland paid for its flight with a wildfire defense grant. Not every community has one.

This is the half of the year where the Collaborative needs help. The pilots, the aircraft and the method are here. Funding is what turns them into flights for the communities that cannot pay.

Whose work this is

The Ashland work on this page was led by Eli Polsky, who founded and runs the Collaborative, and flown by Rogue Reconnaissance, his company, for the city in 2023 and 2024, before the nonprofit was incorporated. It is here because it shows what the Collaborative and its pilots can do.

What funding supports

Flights for communities that cannot pay
LiDAR, multispectral and colour imagery for a small town's wildfire protection plan.
Processing
The software, cloud computers and online GIS behind every flight.
Funded time
One person to run the system and do the outreach.
Pilot and GIS training
Bringing new districts and departments onto one standard.
Public archive and web maps
Hosting, storage and domains.
Equipment and travel
Sensors and aircraft for the roster, and getting crews to communities across the state.

Support the off season

Fund the map that comes before the fire.

Half the year is mitigation. A gift helps put the same pilots and the same standard to work for a community before it burns. If your town, district or neighborhood needs this map, tell us where.