Everything the Collaborative does happens after something is already burning. A pilot flies at night, the heat is mapped, and the sheets go to the incident before the morning briefing. That is the job, and the case studies are full of it.
This note is about the other end of the same problem, because the ground a fire runs through can be measured years before anyone needs a map of it, and the measurement is not very different.
A cloud of points, not a picture
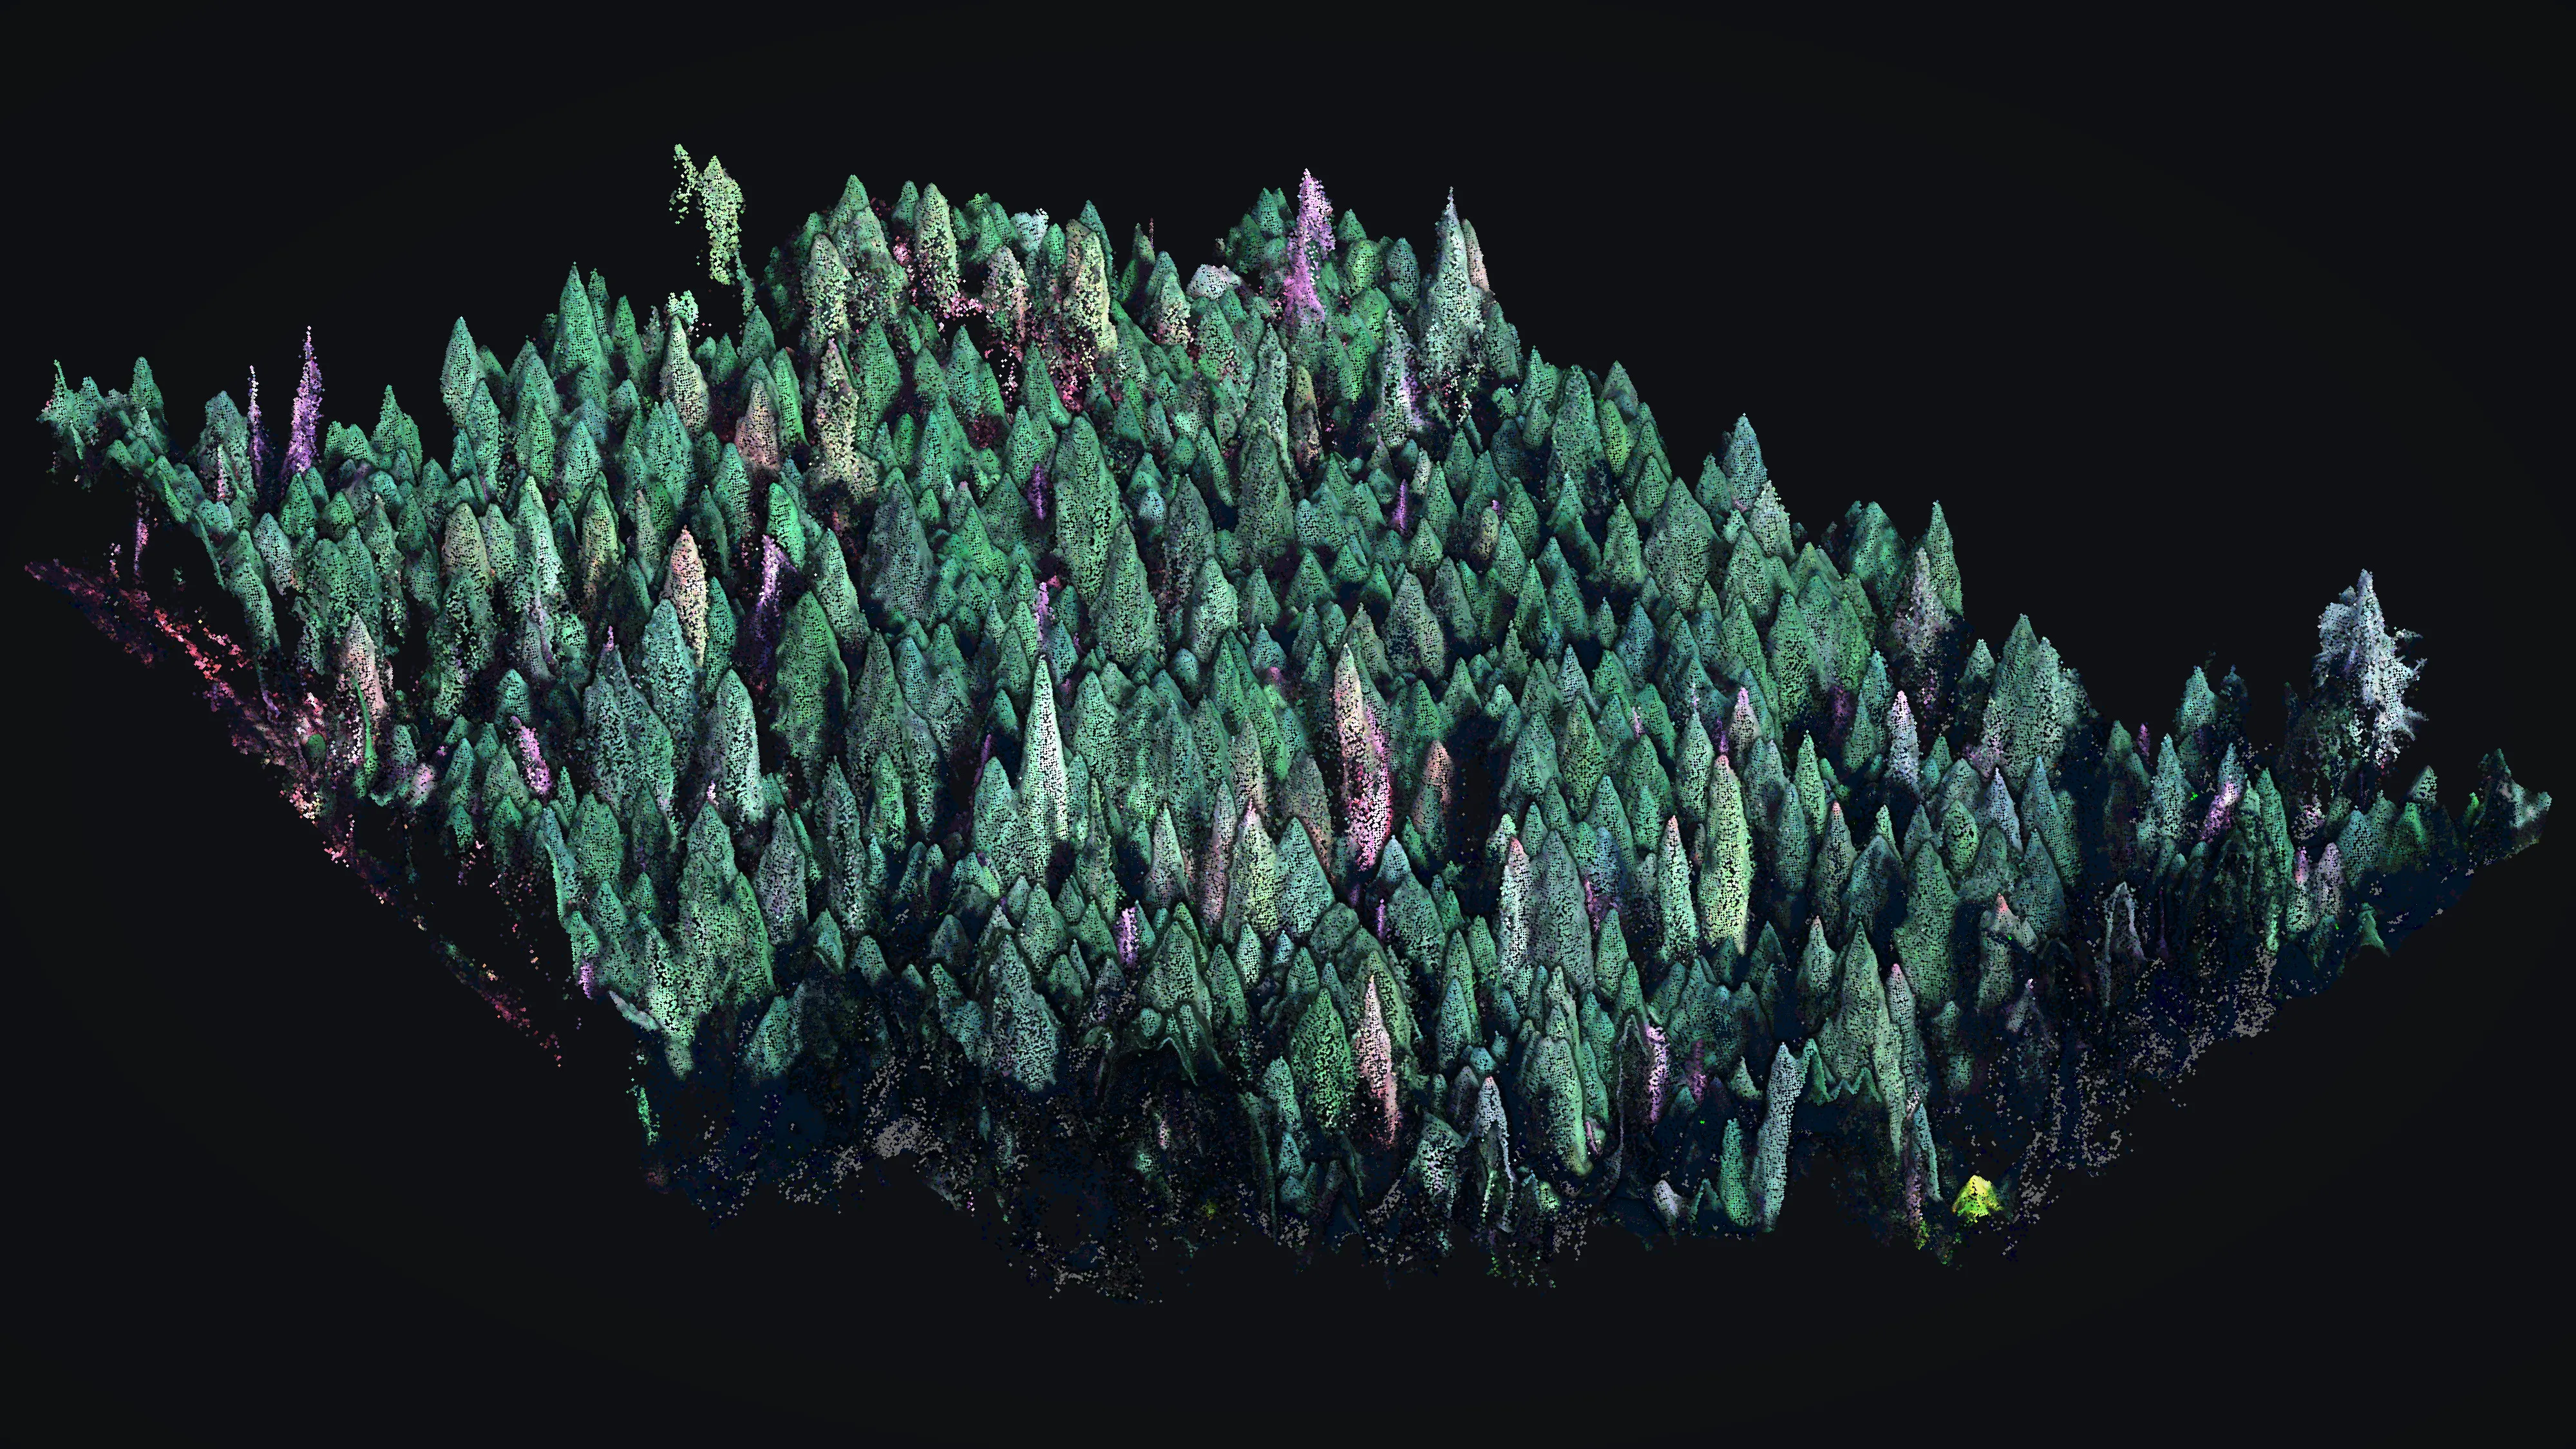
An aircraft flying a forest records millions of separate returns. Some of them land on the top of the canopy, some filter through gaps and land on branches partway down, and some reach bare dirt. Sort them out and you have two surfaces: the ground, and everything standing on it. Subtract one from the other and every return in the air carries a number: its height over the dirt underneath.
That number is the whole thing. It is what a canopy height model is made of, and it is what lets anyone ask a question a photograph cannot answer: not how much forest is here, but how the forest is stacked.
Why stacking is the fire question
A fire on the ground stays on the ground unless something carries it upward. Brush, small trees and low limbs are that something, and the interagency word for them is ladder fuel. Where a deep clear space separates low fuel from the canopy above, a fire that starts underneath usually stays underneath. Where that space is filled in, the same fire climbs, and a fire up in the canopy behaves differently in every way that matters to the people working it.
You cannot see that gap from above. A photograph of closed canopy looks the same whether the space beneath it is open or packed. The vertical profile is the only thing that tells you, and a scan measures it directly.
Dead trees are part of the same answer
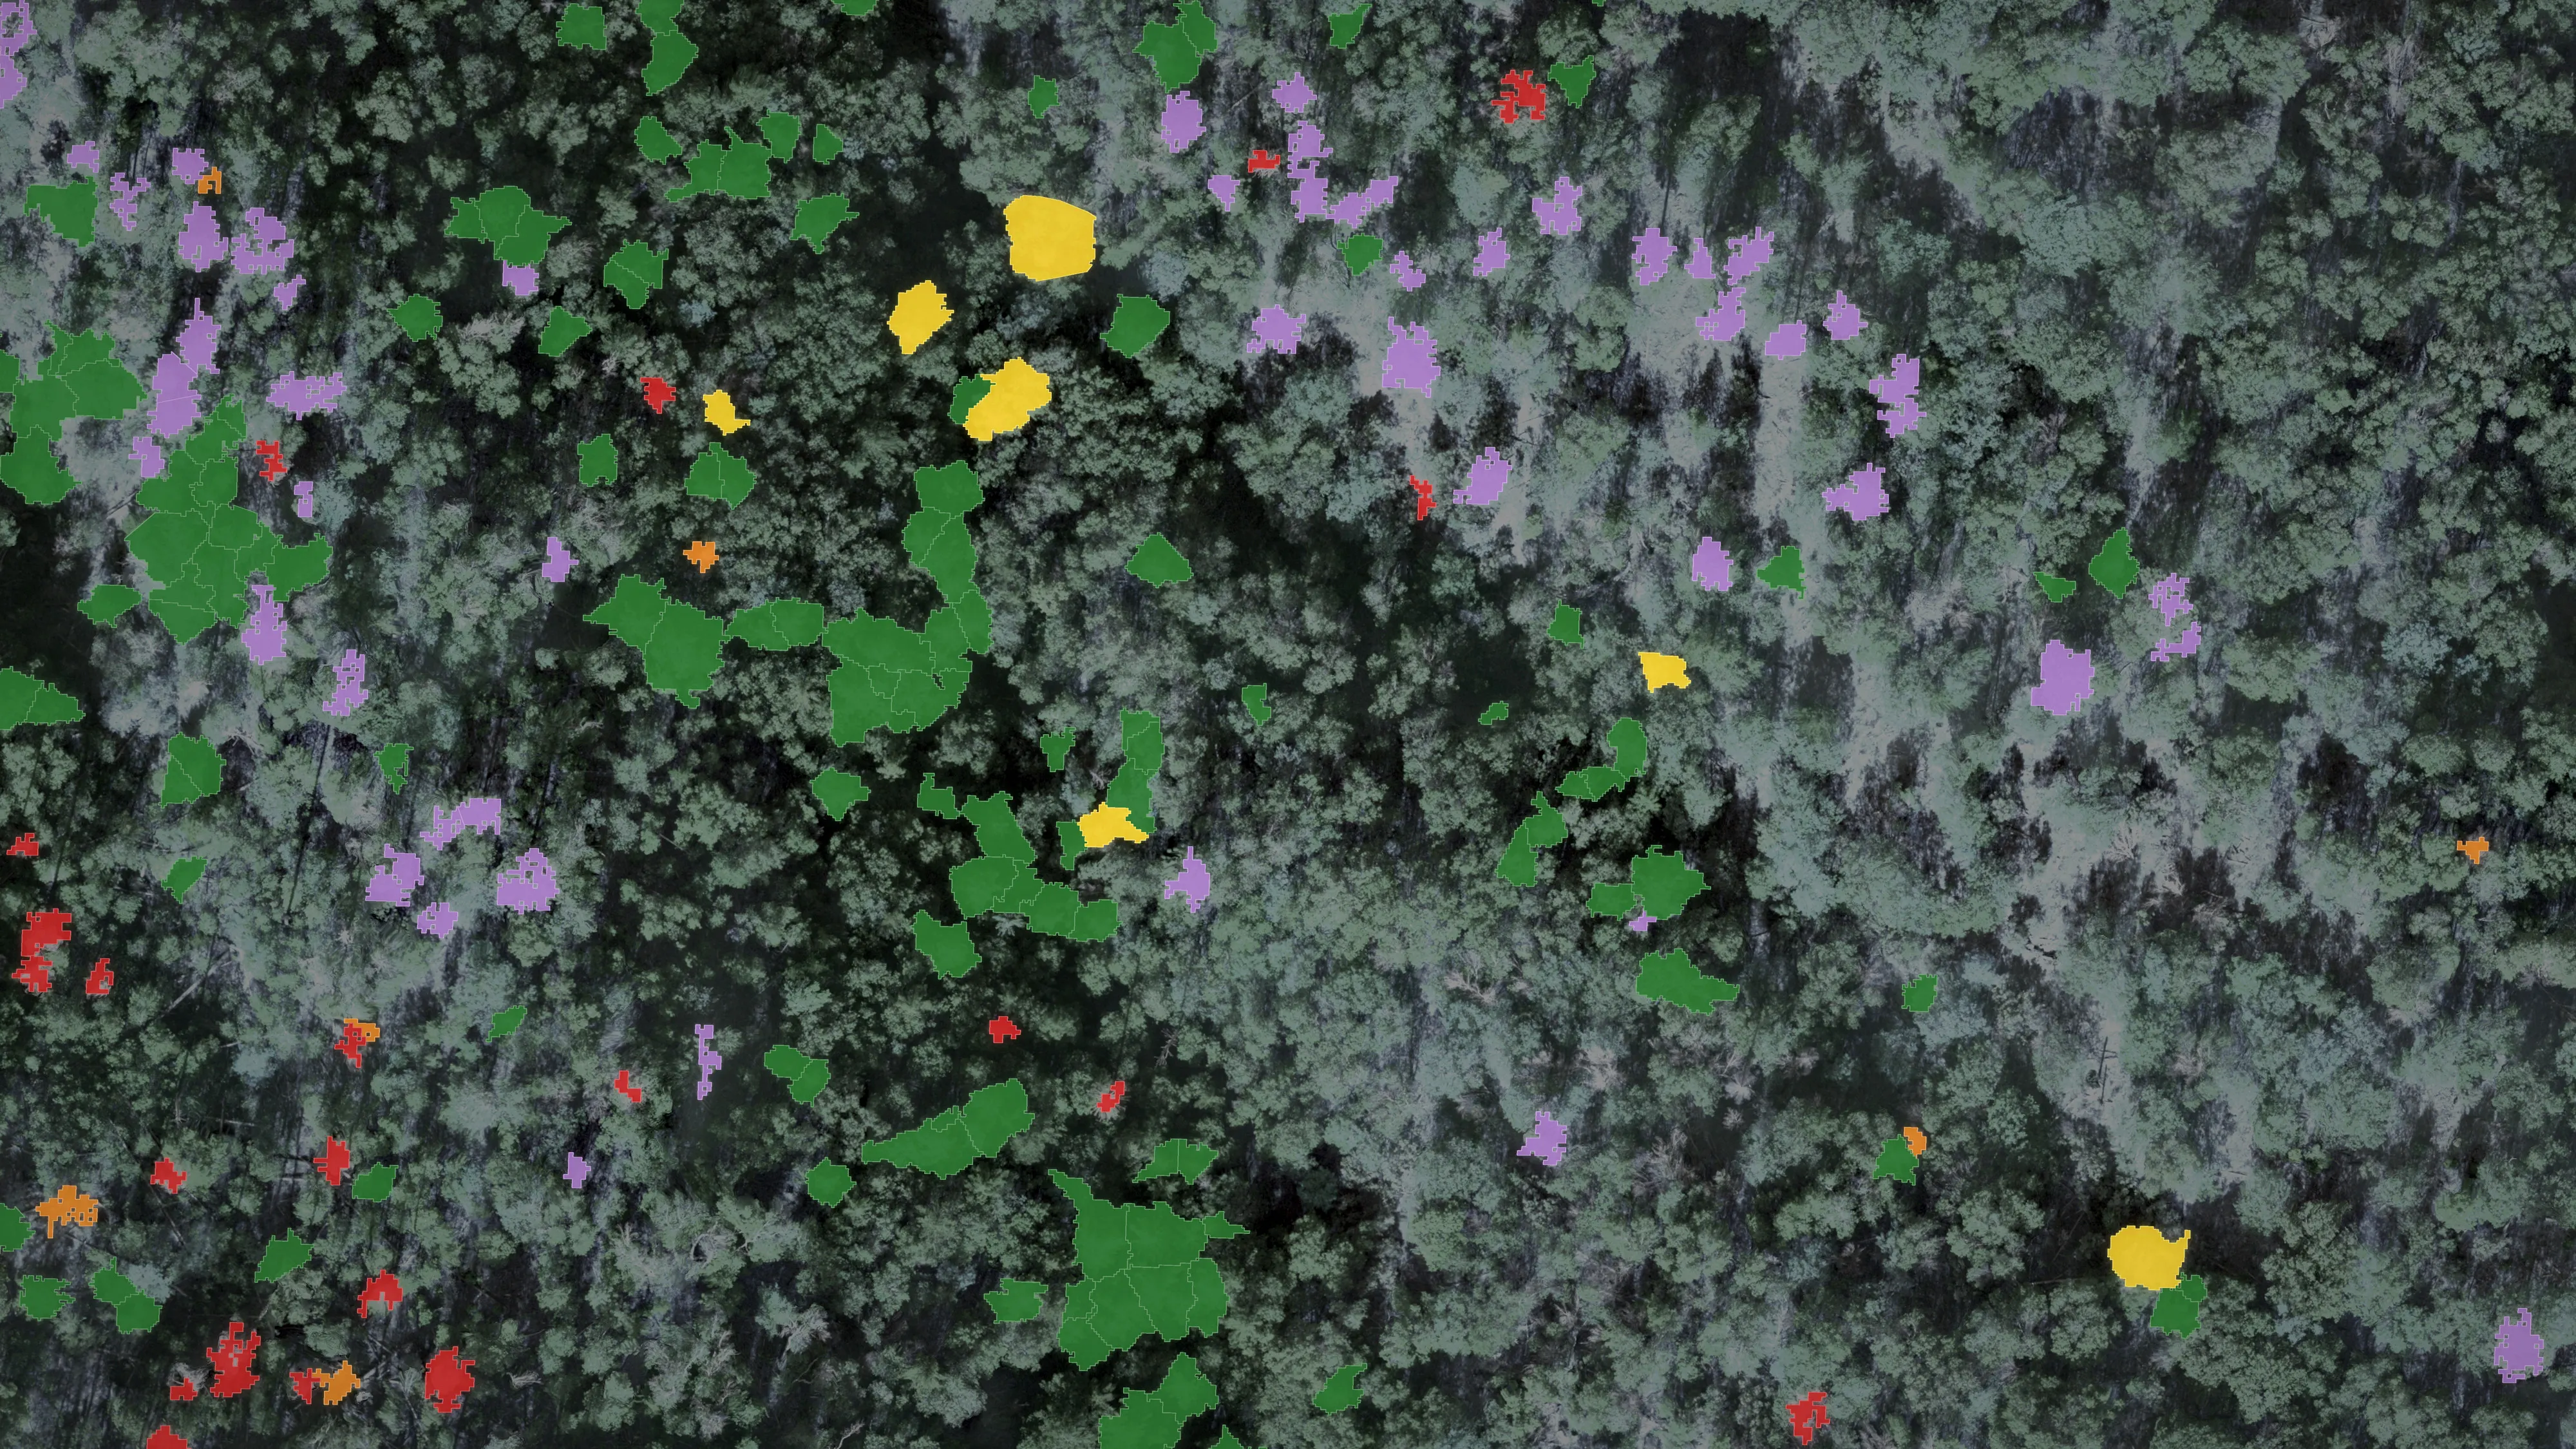
The picture below on the right is the same flight sorted a second way. Each crown carries a health class, and the trees that are dying or already dead are marked. A standing dead tree is worth knowing about twice over. It can come down on a road or a trail without any fire at all, and when there is one, dry standing timber is not the same fuel as a live tree.
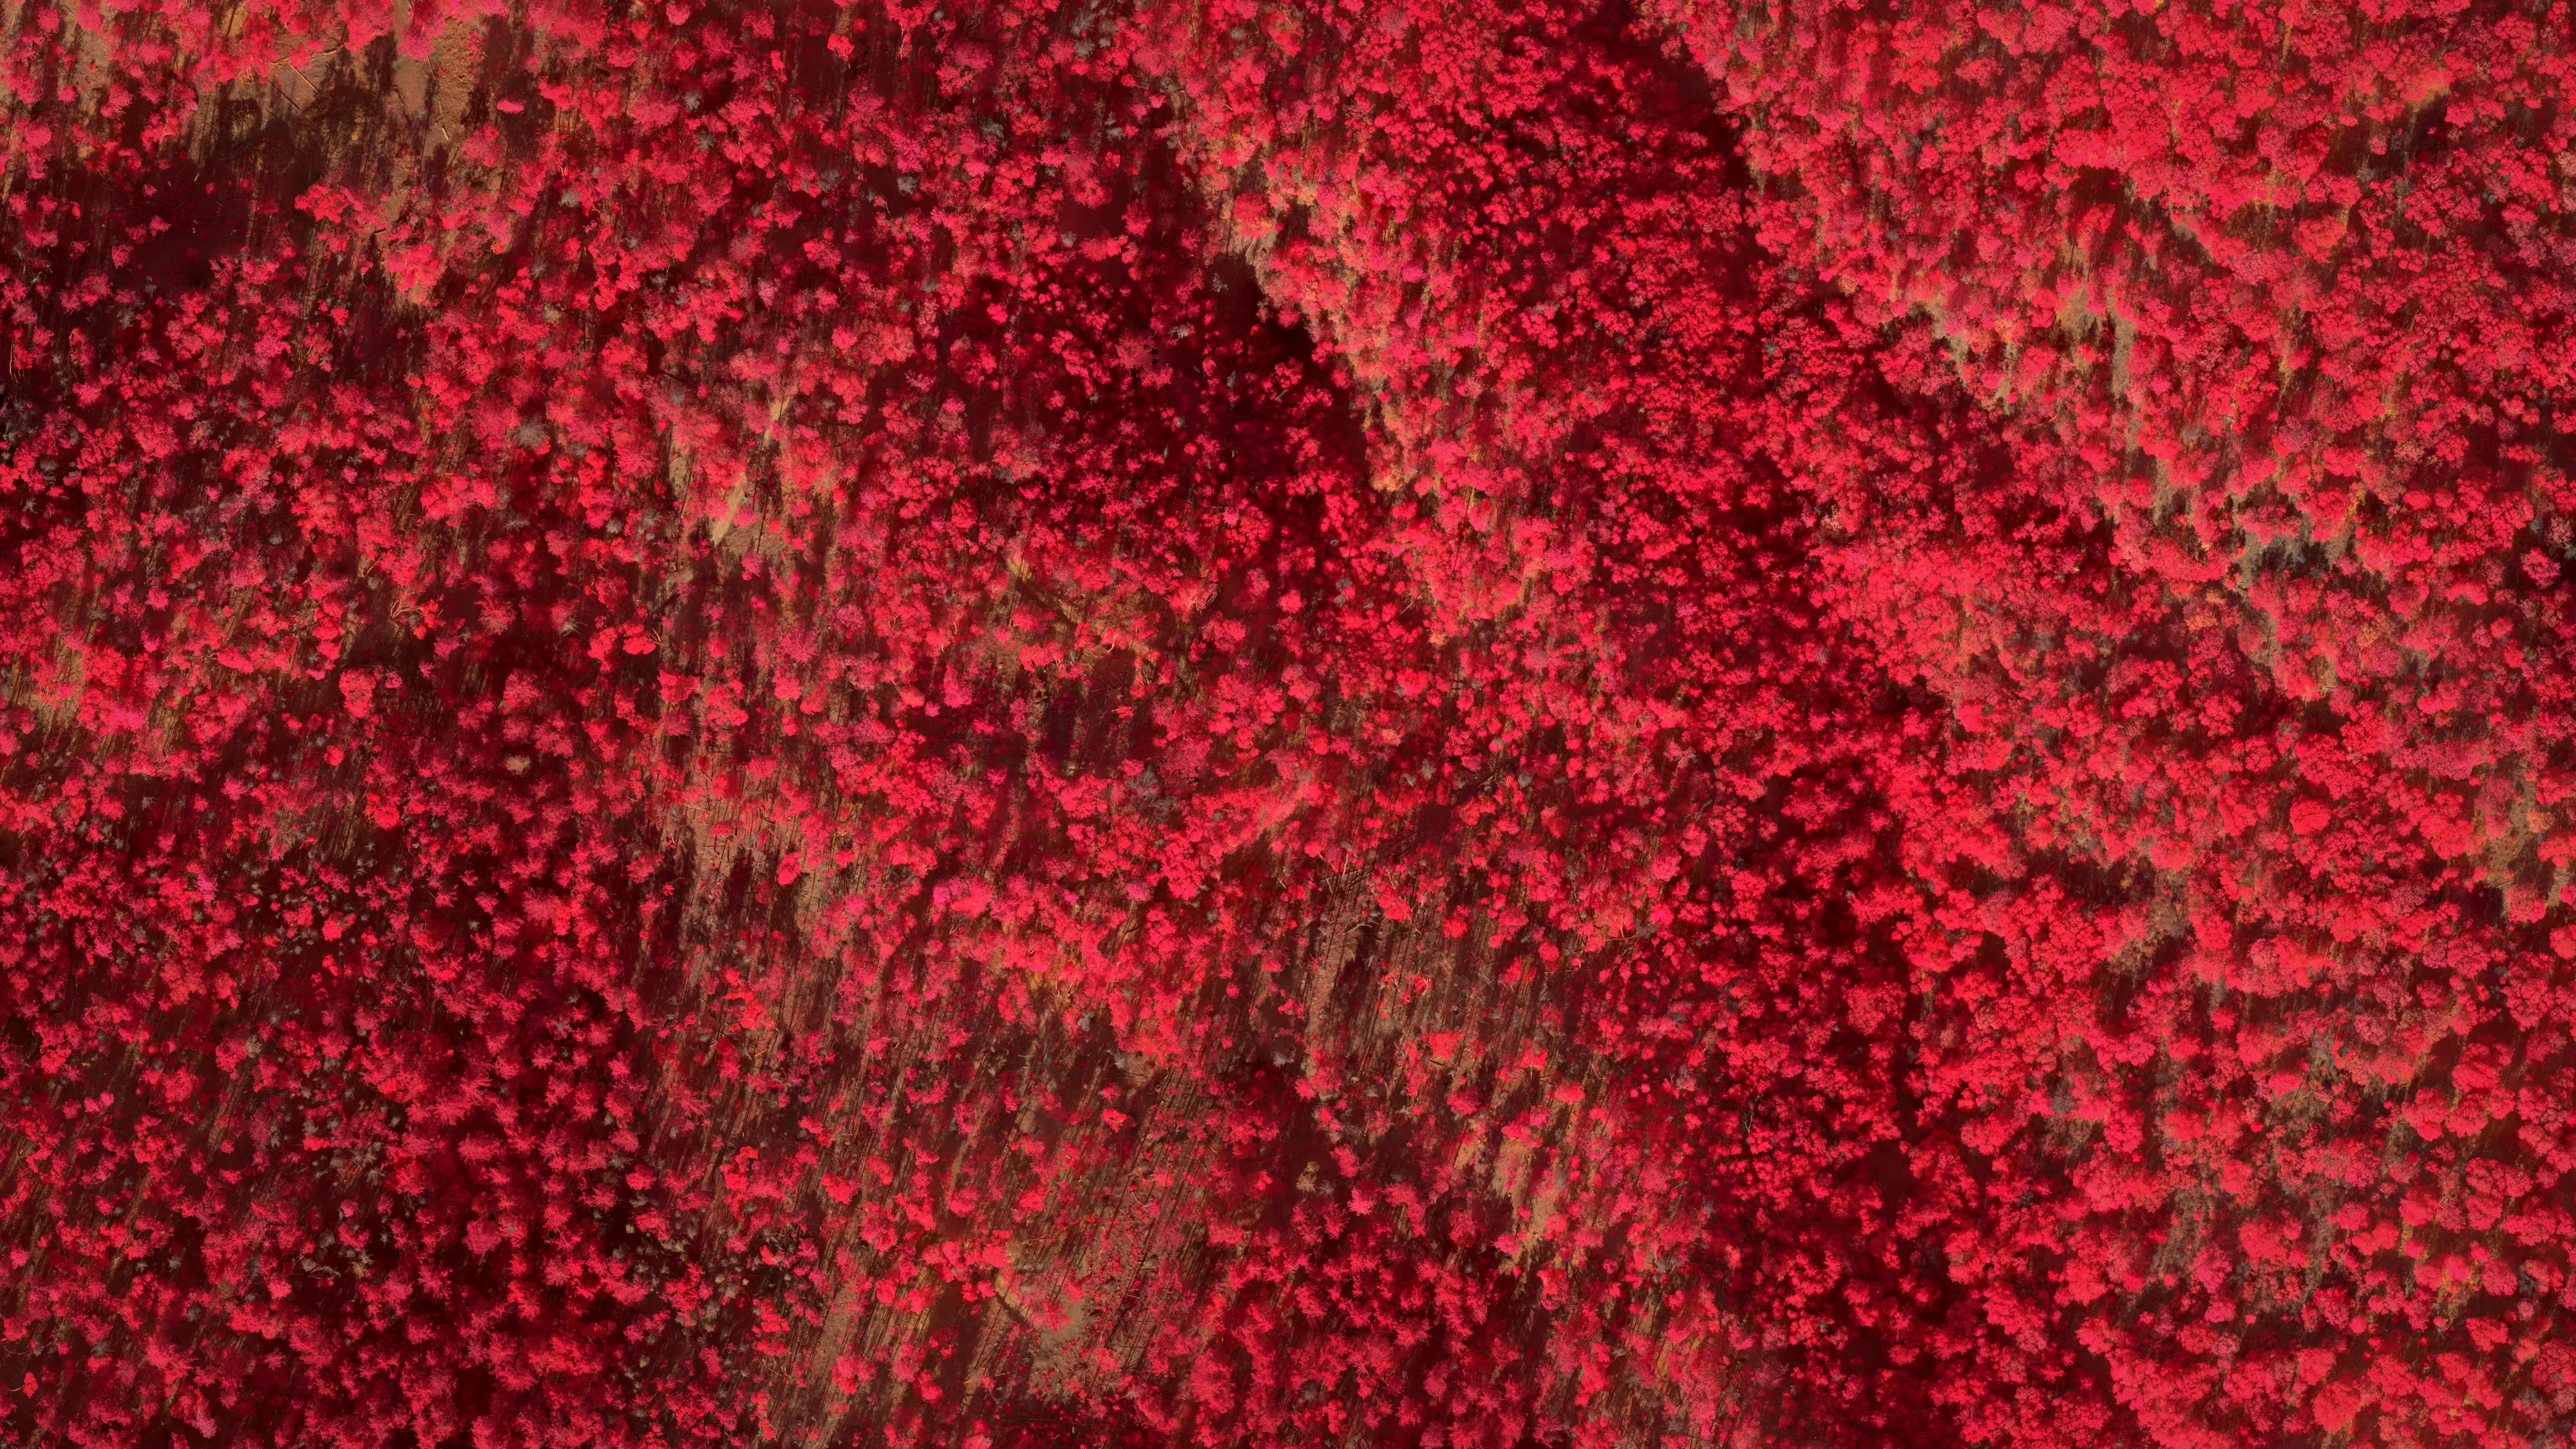
Sorting them needs more than shape, which is where the middle picture comes in. Living vegetation reflects near infrared light strongly and visible red weakly. Put the infrared band where red normally goes and a healthy conifer prints crimson while a dead one turns grey. That contrast is the signal a classification is trained on.
Where these came from, and why they are here
These three frames were rendered from work flown in 2024 by Rogue Reconnaissance, the founder’s company, under contract to the Oregon city of Ashland, before this nonprofit existed. That job measured the forested watershed land the city owns and sorted roughly thirty thousand Douglas fir into health classes. The wildfire protection plan Ashland adopted the following year is a public document, and its fuels figures come from that data.
None of it was flown by the Collaborative, which did not exist yet. It is here because the two halves belong to each other. A division supervisor reading a heat map at four in the morning and a planner deciding where to thin are asking about the same structure, measured the same way, at different moments in its life. Anyone standing up a program for either one is better off knowing that the other exists.
That second half now has a page of its own. Fire preparedness shows what the same pilots can map in the off season, what Ashland did with it, and what it takes to fund it for a community that cannot pay.
For the half that runs every summer, the case studies are nine fires from the 2026 season, told night by night through the sheets the incidents actually received.
Support the Collaborative
Keep the map in a crew's hands.
Heat hides in stumps and roots after the flames pass. The system that maps it for crews is running on live incidents, and a gift keeps it ready for the next fire season.