2026 wildfire Grant County, Oregon
Bologna
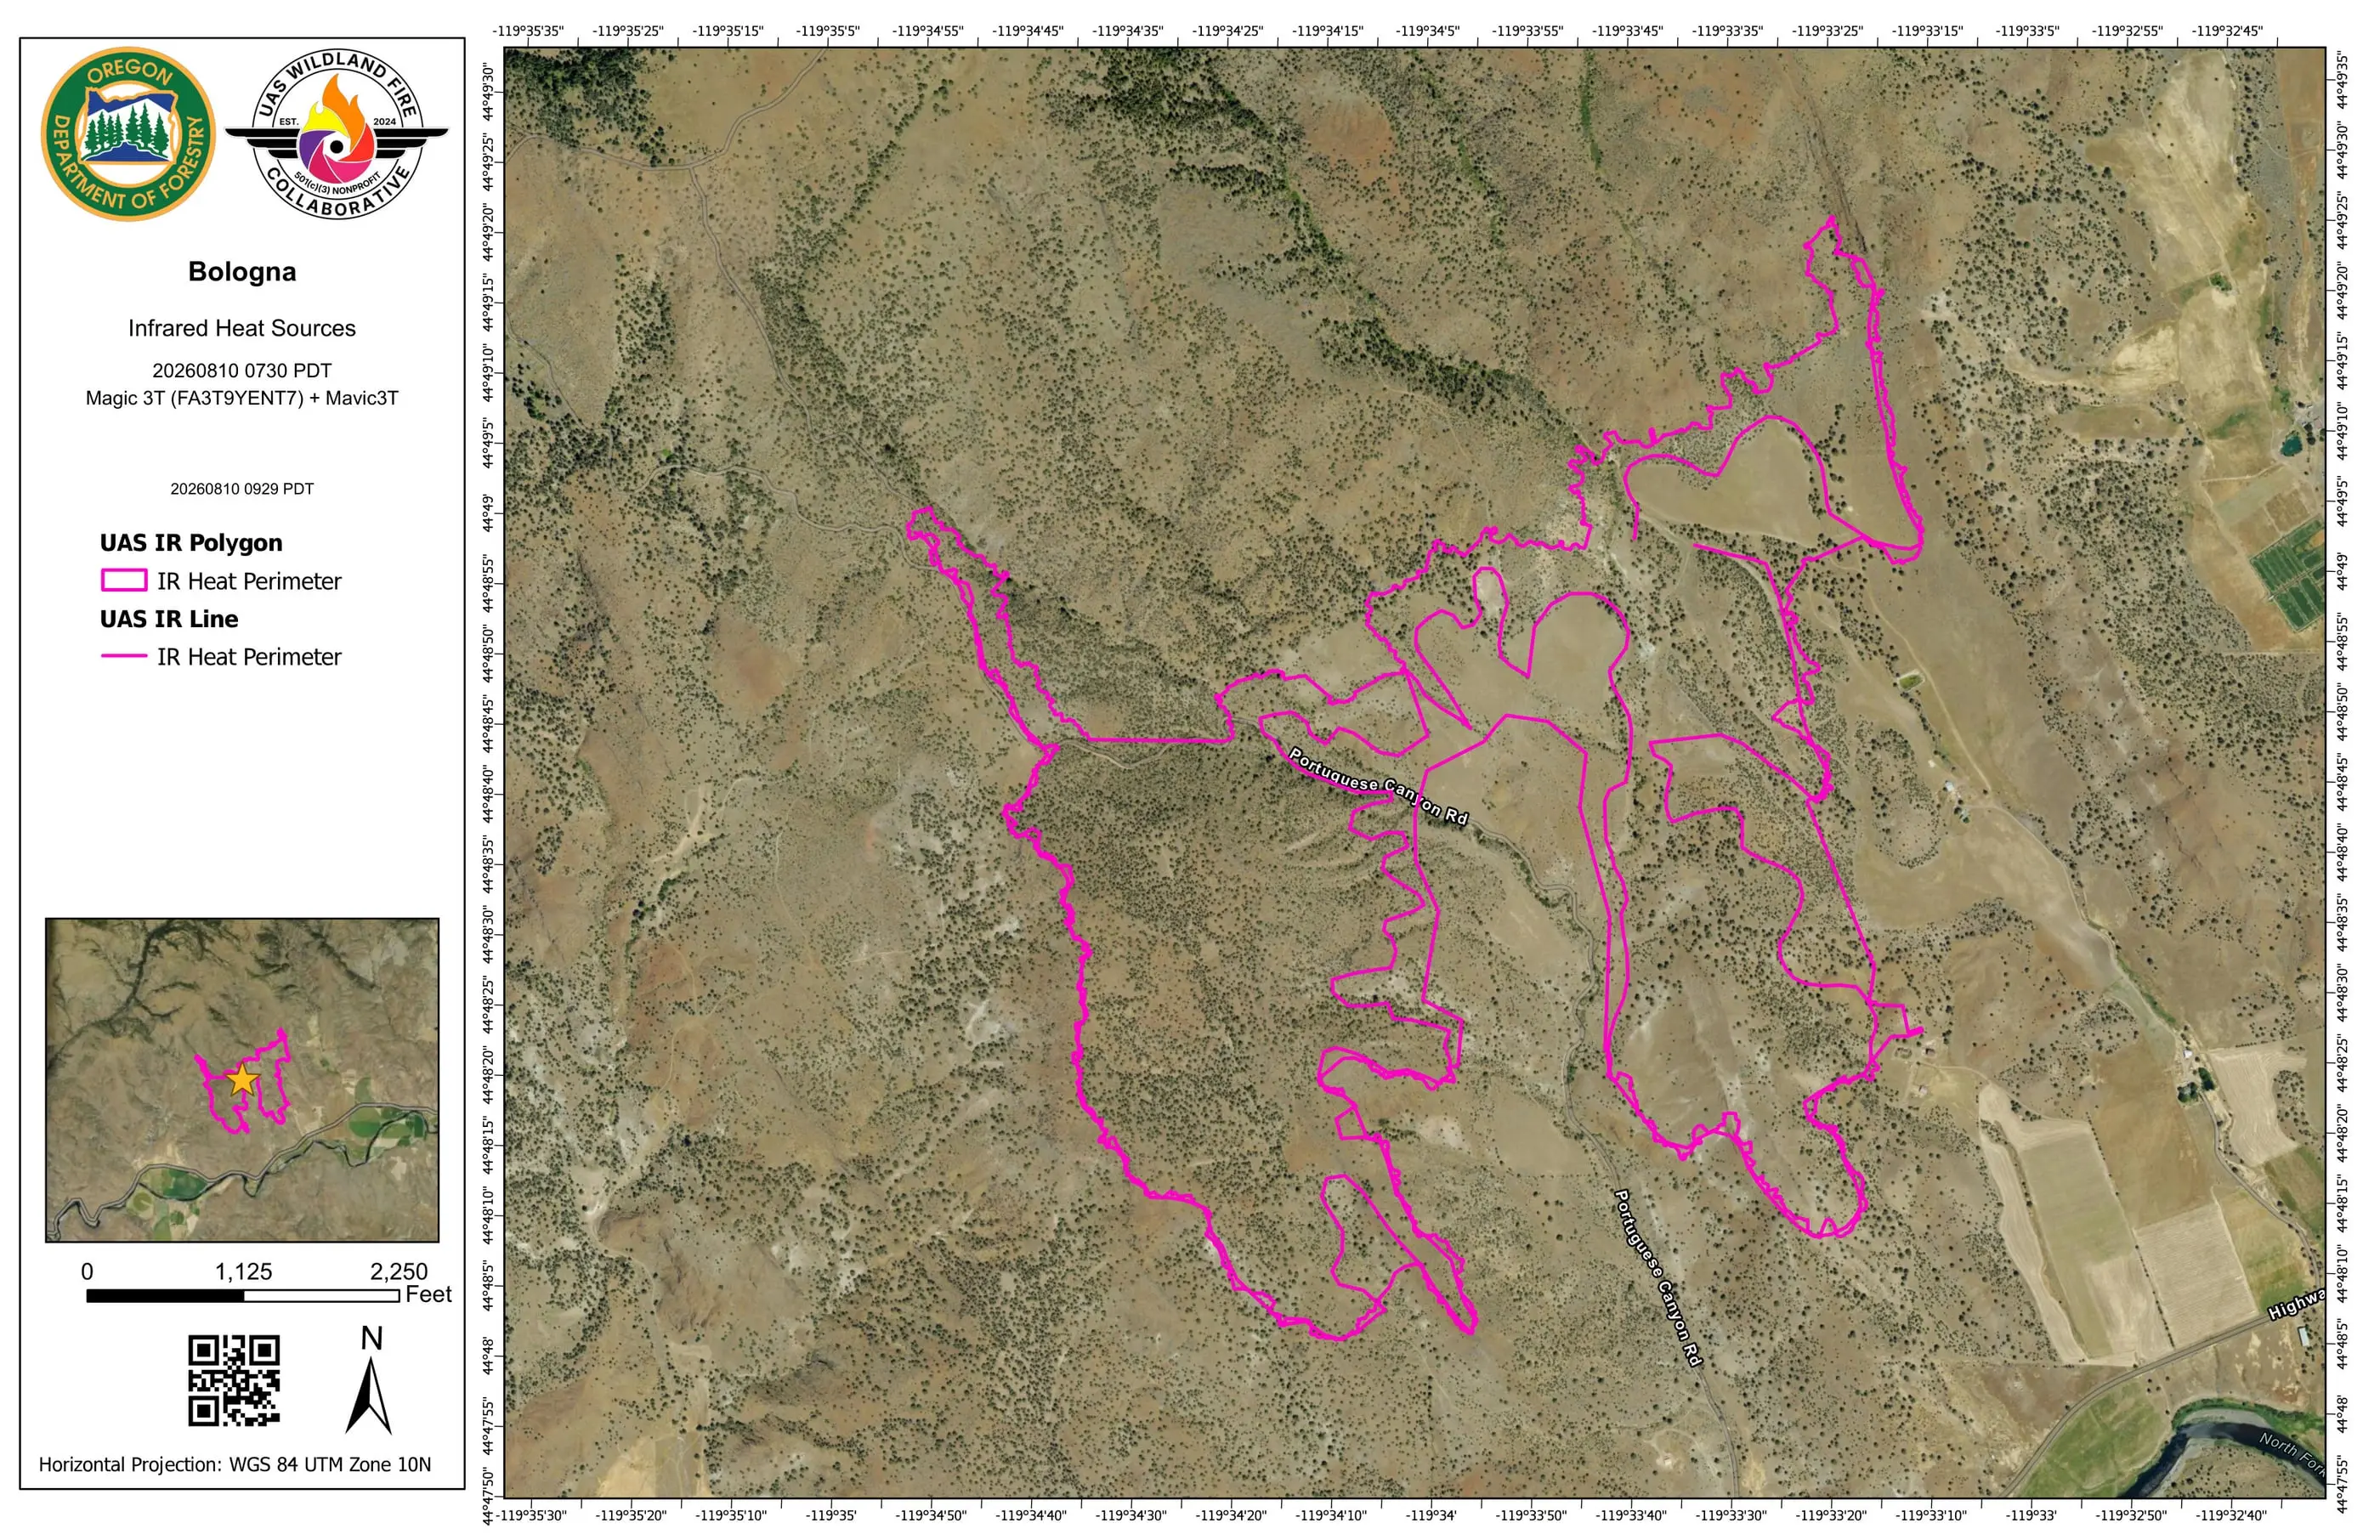
A pink heat perimeter from a state drone, then a week of flights along the line as the heat near it faded.
- Nights of maps
- 8
- July 18 to August 18
- Map sets delivered
- 12
- From two flying teams
- Heat sources on the busiest map
- 9,904
- South end, night of August 9
- Acres on the incident record
- 4,436
- Read September 13, 2026
Where it burned
Bologna burned in open, sage covered hills in Grant County. Its sheets print Portuguese Canyon Road running through the fire, Highway 402 and the North Fork John Day River along its south end, and Rains Canyon to the east. On August 14 the crew launched from beside Highway 402.
Two organizations, two jobs
Bologna was reported on July 16 in Grant County, with a natural cause on the record. Its first map set in the system was a crewed infrared flight on the night of July 18, read from the perimeter the aircraft’s crew posted to Intterra. That set is on the record but not in the public archive, and the table below says so.
On the morning of August 10 the Oregon Department of Forestry flew a DJI Mavic 3T to map the southernmost extent of the fire’s progression, and delivered three map sets that morning. The first is the pink perimeter at the top of this page. The two that followed marked heat sources across the same ground.
A week along the line
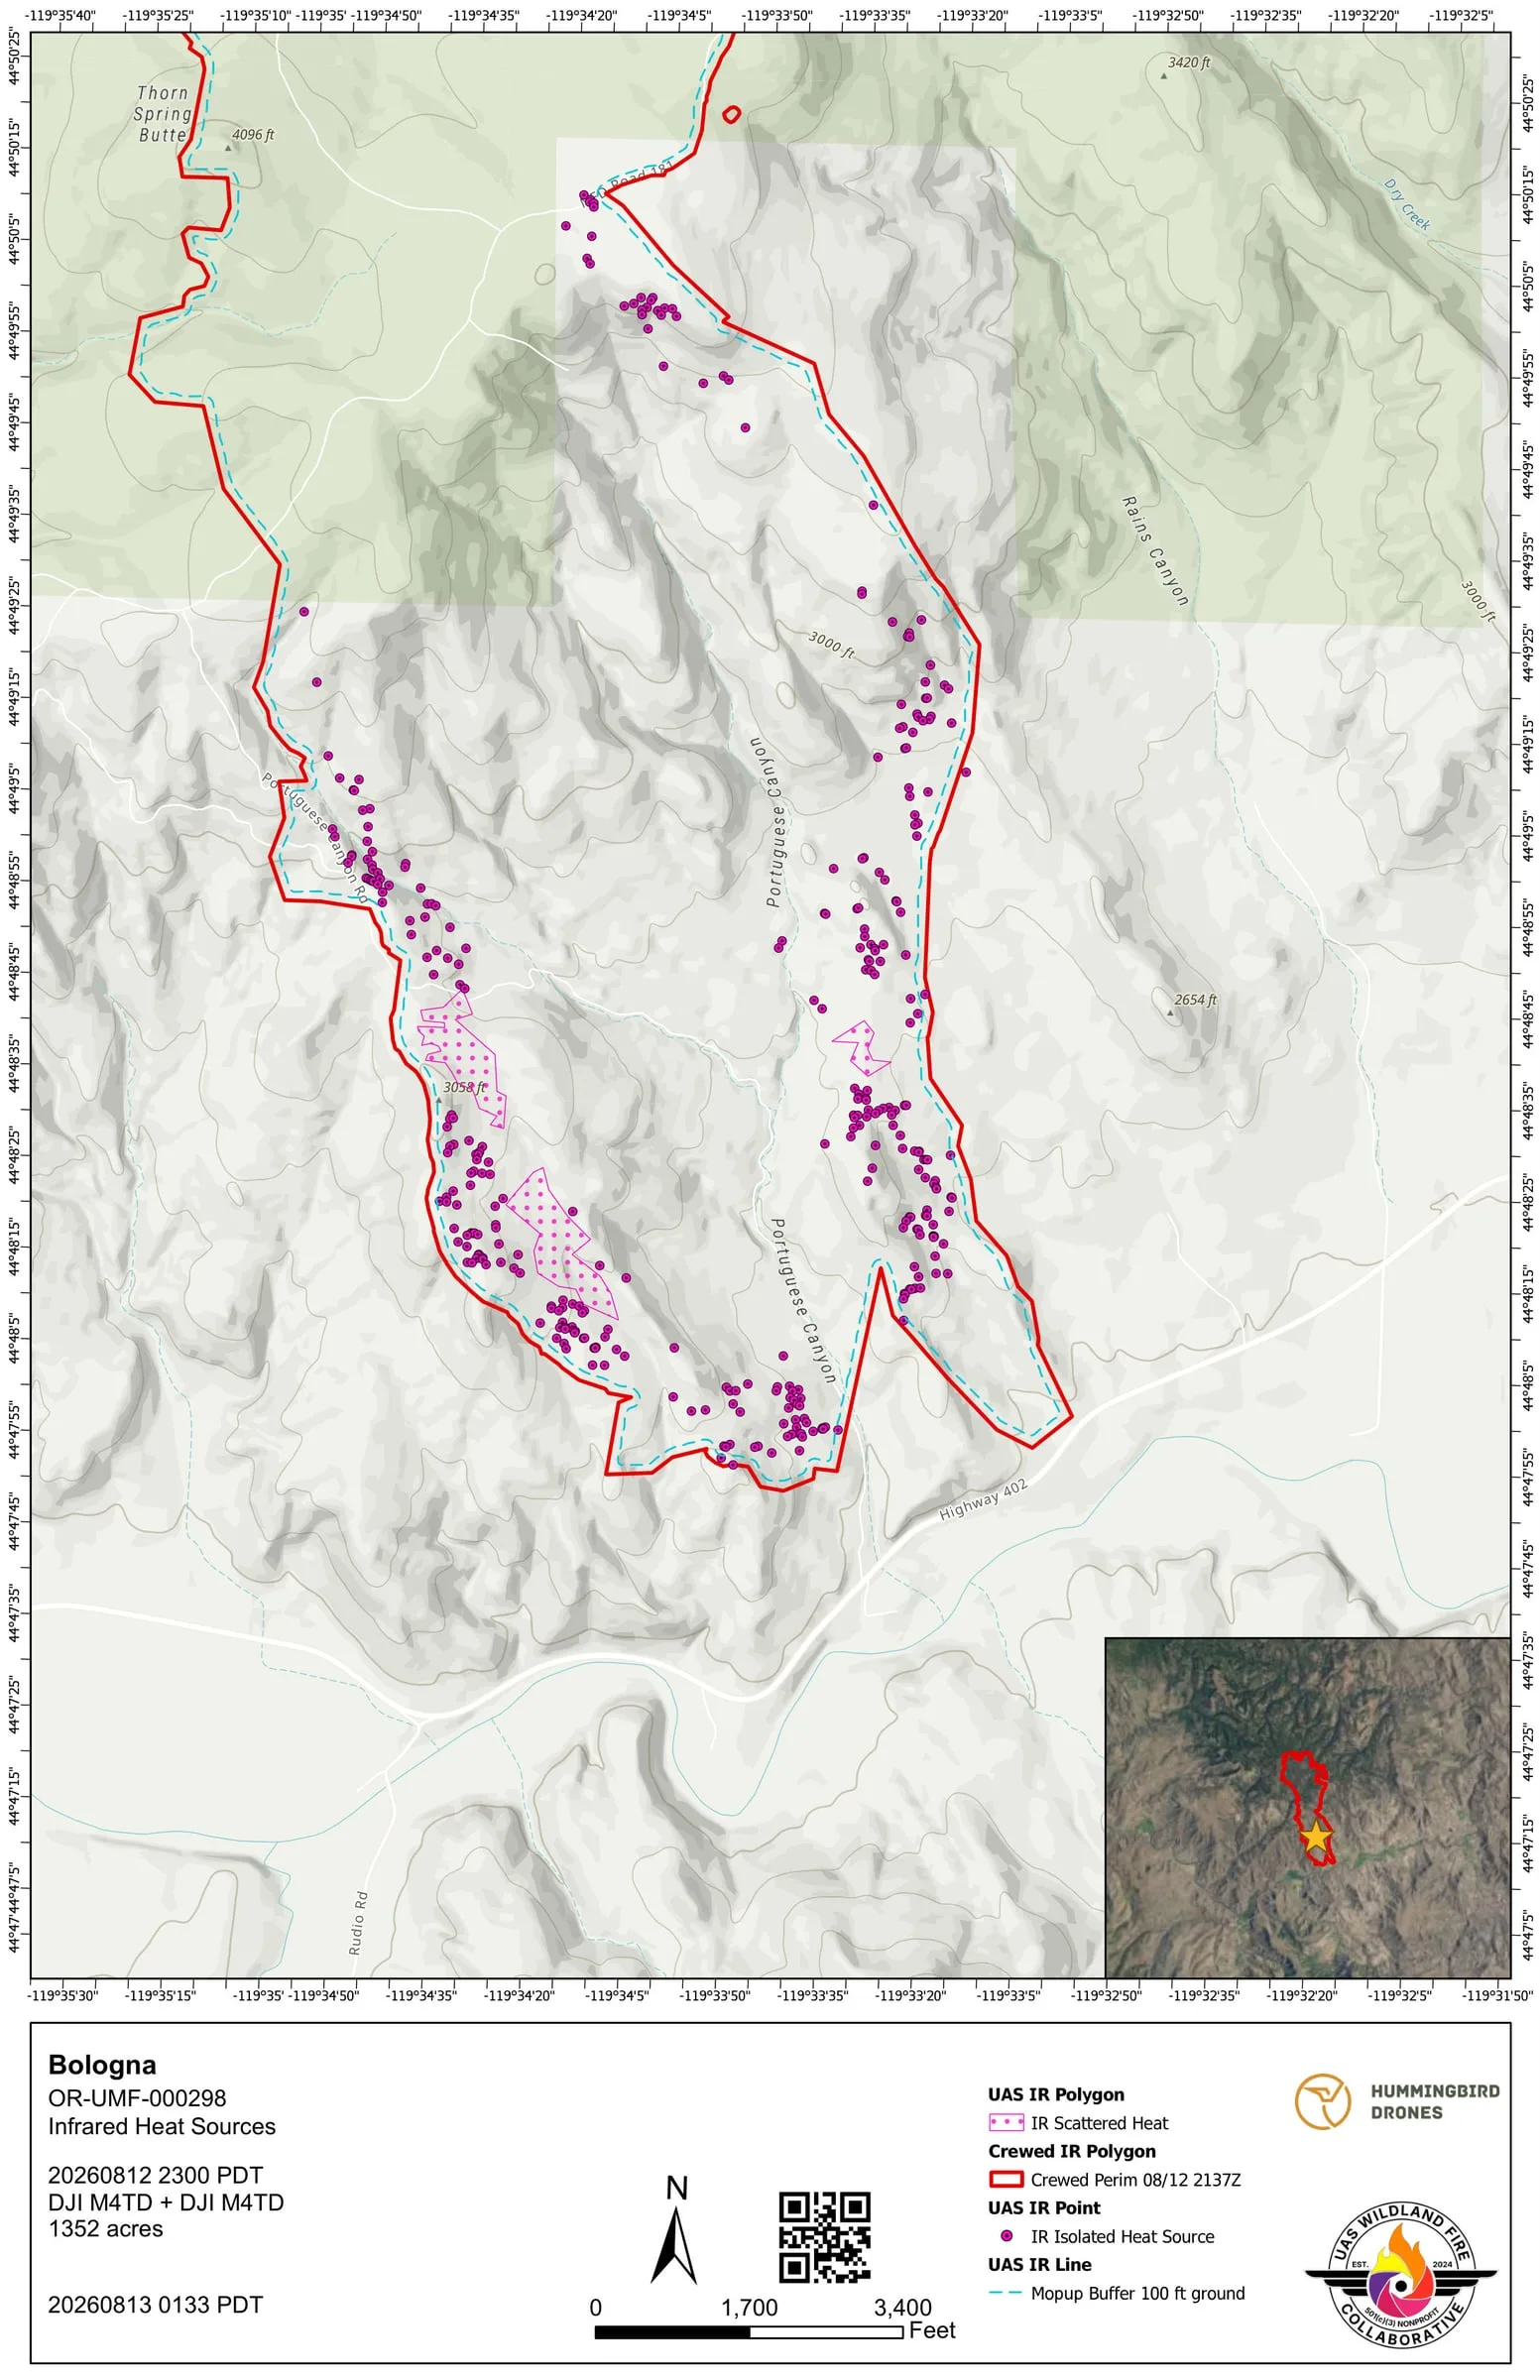
From the night of August 12, Hummingbird Drones flew Bologna night after night: perimeter scans at first, then flights focused on the ground within 500 feet of the line. Every one of those maps carried the incident’s daily fire perimeter in red beside the drone’s pink heat. The heat sources on them fell from 351 on the first night to 6 on the last.
From August 16 the maps also drew an outside buffer 400 feet beyond the perimeter, marking the band a crew checks for spot fires. On the last three nights it had very little to show.
What the Collaborative did
Two flying teams. The system did the rest.
Every map set on this fire came back as two thermal map sheets, one on aerial imagery and one on a topographic base, with a daily log, a Google Earth file and the GIS layers, on the flying organization’s own template.
- 66 files in the public archive Filed by night under the folder and file names the interagency share uses, free for anyone to open.
- 8 map sets carry the daily fire perimeter The incident’s own interagency perimeter, pulled onto the map in red beside the drone’s pink heat.
- 1 crewed flight mapped A crewed infrared aircraft’s perimeter, turned into the same standardized map set a drone flight gets.
- 16 min median, upload to approved maps Across 11 map sets with both times on the record, including the pilot’s own review before approving.
- 100 to 400 ft mop up buffers drawn Dashed lines a set distance in from the perimeter, measured along the ground, so a crew can see which heat sits close to the edge.
Delivered to the incident
More thermal map sheets from Bologna
Pink is a drone Red came from elsewhere How to read the map
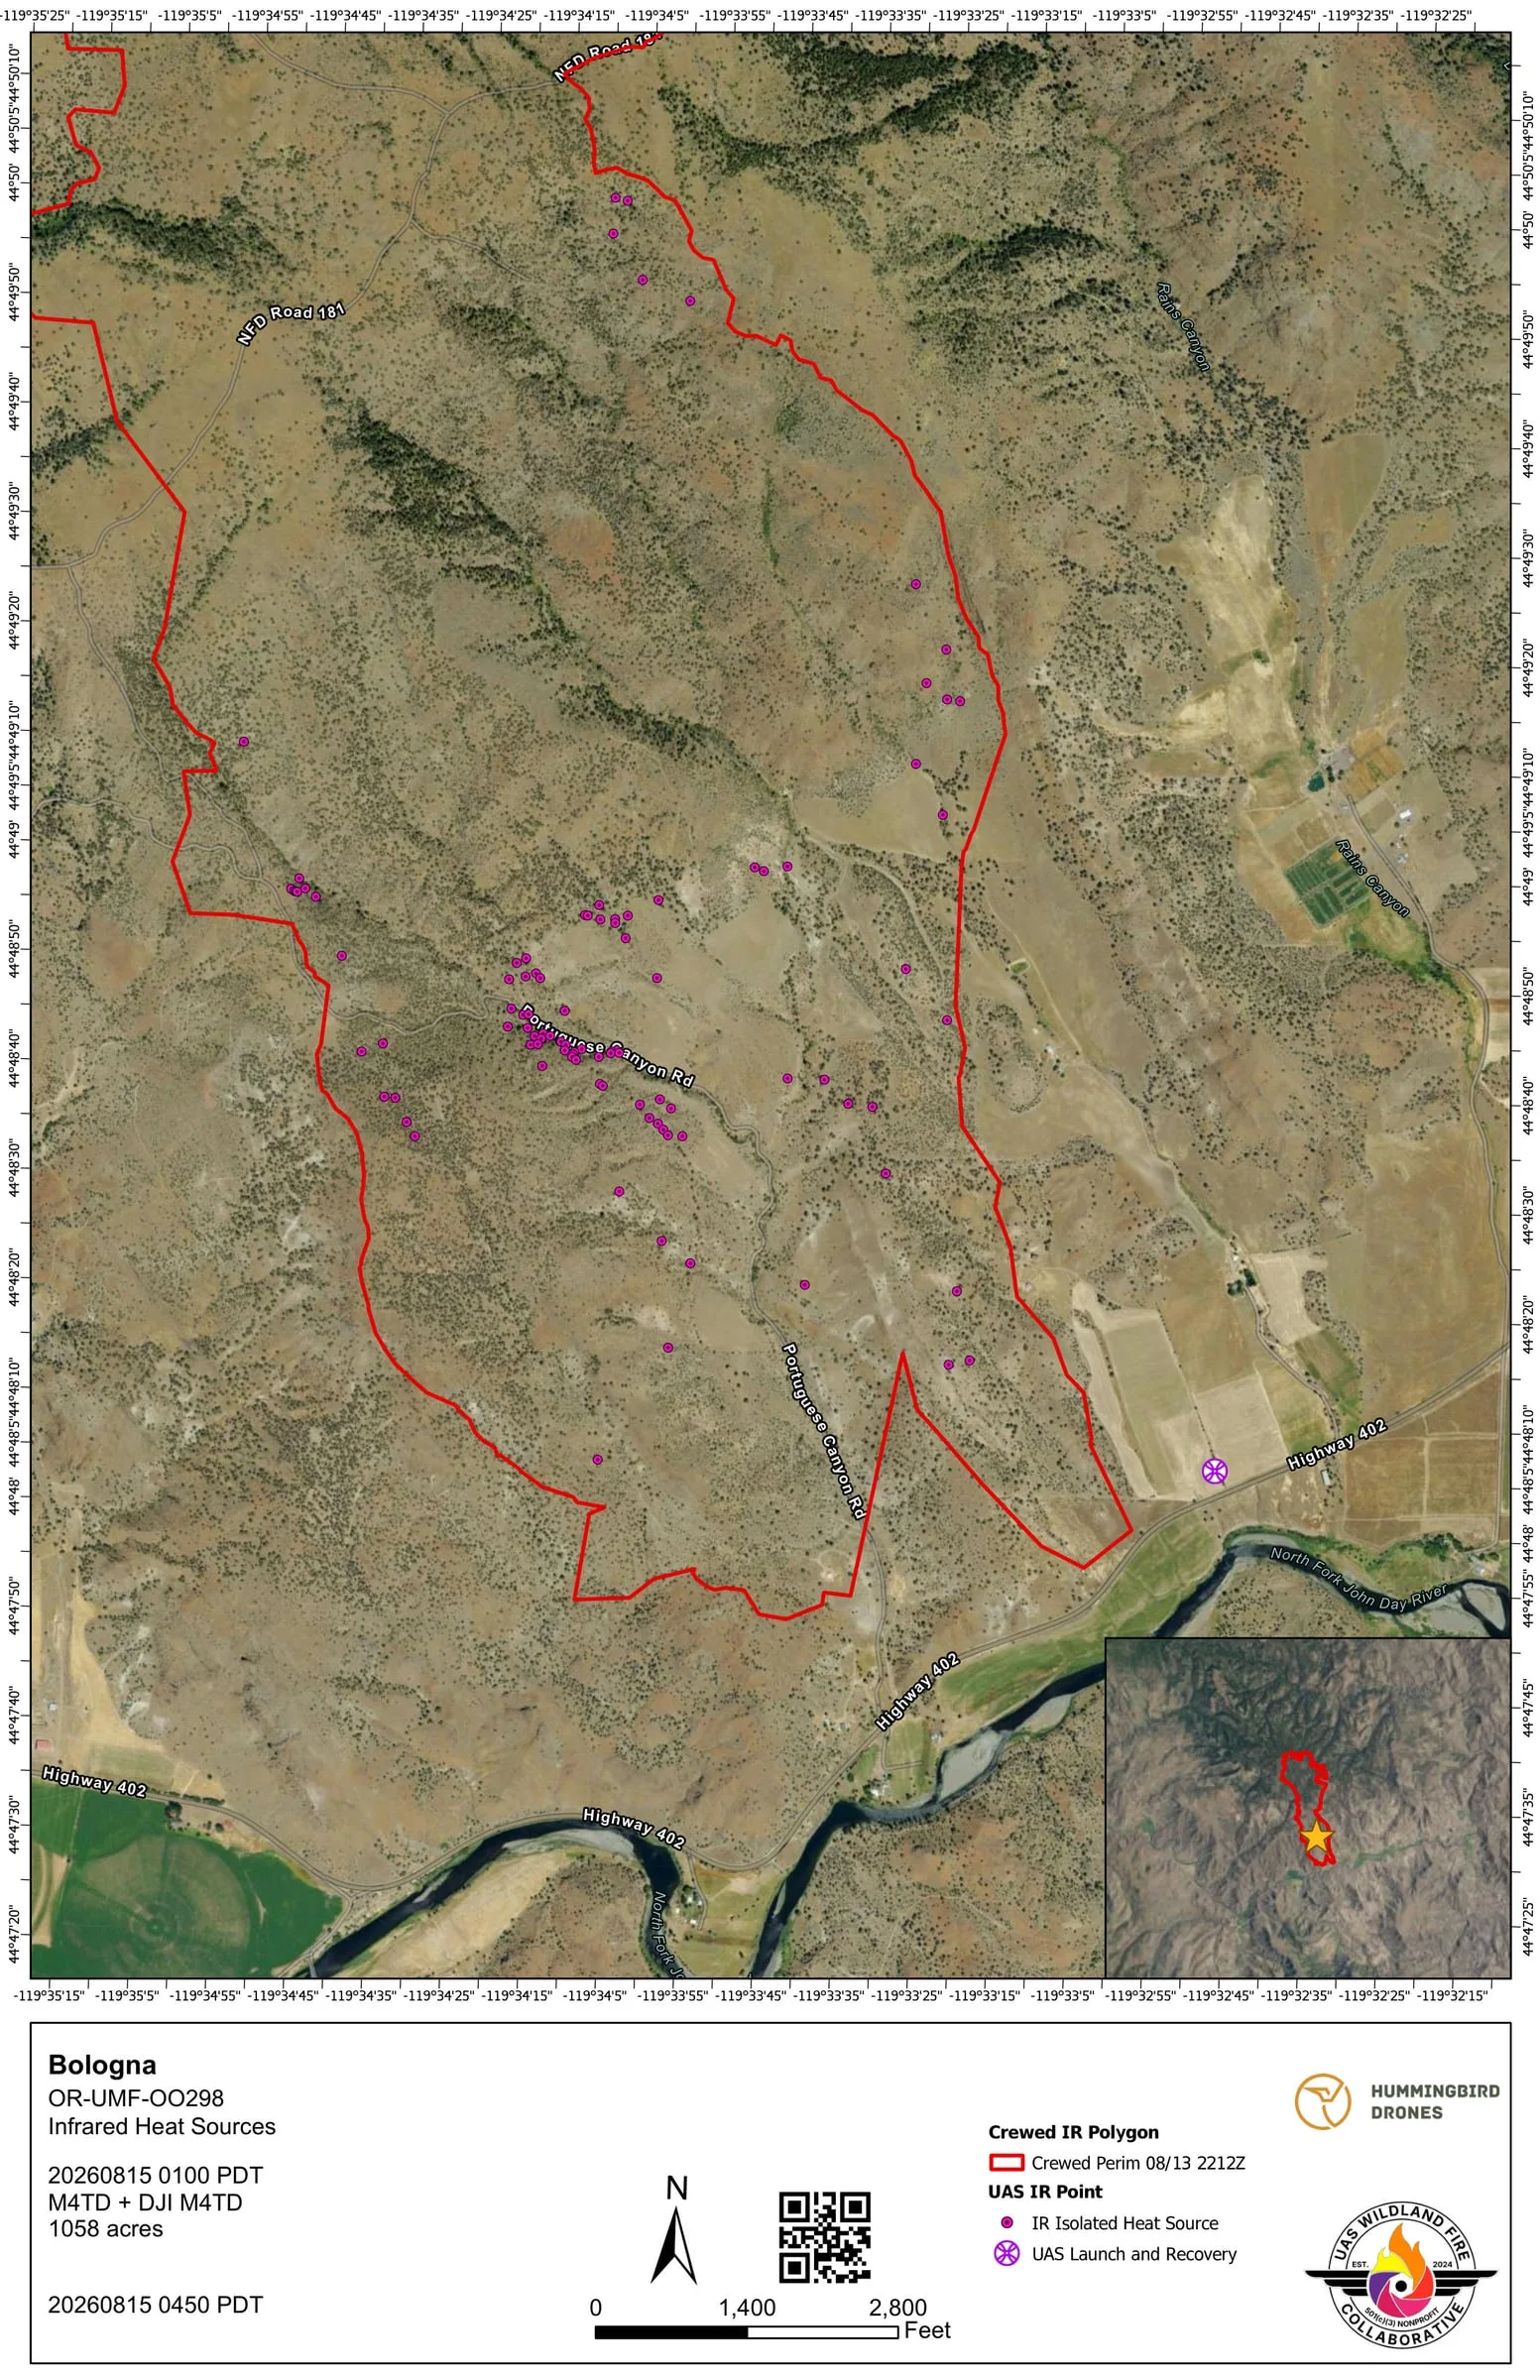
The archive, night by night
Every map set
12 map sets over 8 nights
One row per map set, grouped by night. A flight after midnight counts with the night before it, and the archive files each night under the next day's date, the operational period its maps served. Where two flights covered the same ground in one night, a heat source can appear on both maps, so the nightly numbers are not added into a trend.
- Hummingbird Drones
- Oregon Department of Forestry
| Night | Flown | Area | By | Heat sources | Possible heat | Mop up buffer | Archive |
|---|---|---|---|---|---|---|---|
| July 18 | Not shown† | Crewed infrared flight | Perimeter only | None | Not in the archive | ||
| August 9 | 7:30 am | South end | 0 | 0 | None | Open the night | |
| 9:40 am | South end | 9,904 | 0 | None | |||
| 9:54 am | South end | 9,904 | 0 | None | |||
| August 12 | 11:00 pm | Perimeter scan | 351 | 0 | 100 ft | Open the night | |
| August 13 | 10:30 pm | Perimeter scan | 198 | 0 | 400 ft | Open the night | |
| 10:30 pm | Perimeter scan | 152 | 0 | 400 ft | |||
| August 14 | 1:00 am | Perimeter scan | 98 | 0 | None | Open the night | |
| 5:00 am | Perimeter scan | 61 | 0 | 400 ft | |||
| August 16 | 4:00 am | Perimeter scan | 14 | 0 | 400 ft | Open the night | |
| August 17 | 11:30 pm | Perimeter scan | 7 | 0 | 300, 400 ft | Open the night | |
| August 18 | 2:30 am | Perimeter scan | 6 | 0 | 400 ft | Open the night | |
Counted September 13, 2026 from the submission records and the public archive.
- 4 records on this fire are not counted because they were never approved for release.
- 1 approved map set is not in the public archive.
- † The clock is not shown for a crewed flight: crewed records written before August 4, 2026 stored a UTC time as Pacific time, so their clock reads seven hours off. The night is right. The crewed map sets on this record carry the aircraft's heat perimeter only, so their rows show no heat sources.
Where the images came from
- Every sheet on this page is the PDF delivered to the incident and published in the public archive, rendered as an image. The name of the pilot printed in each title block is covered, because this site names organizations, not people.
- The objectives and notes quoted on this page are from the submission records.
- The incident record is the interagency record in WFIGS, read September 13, 2026.
More from the 2026 season
Other case studies
-
East Evans Creek
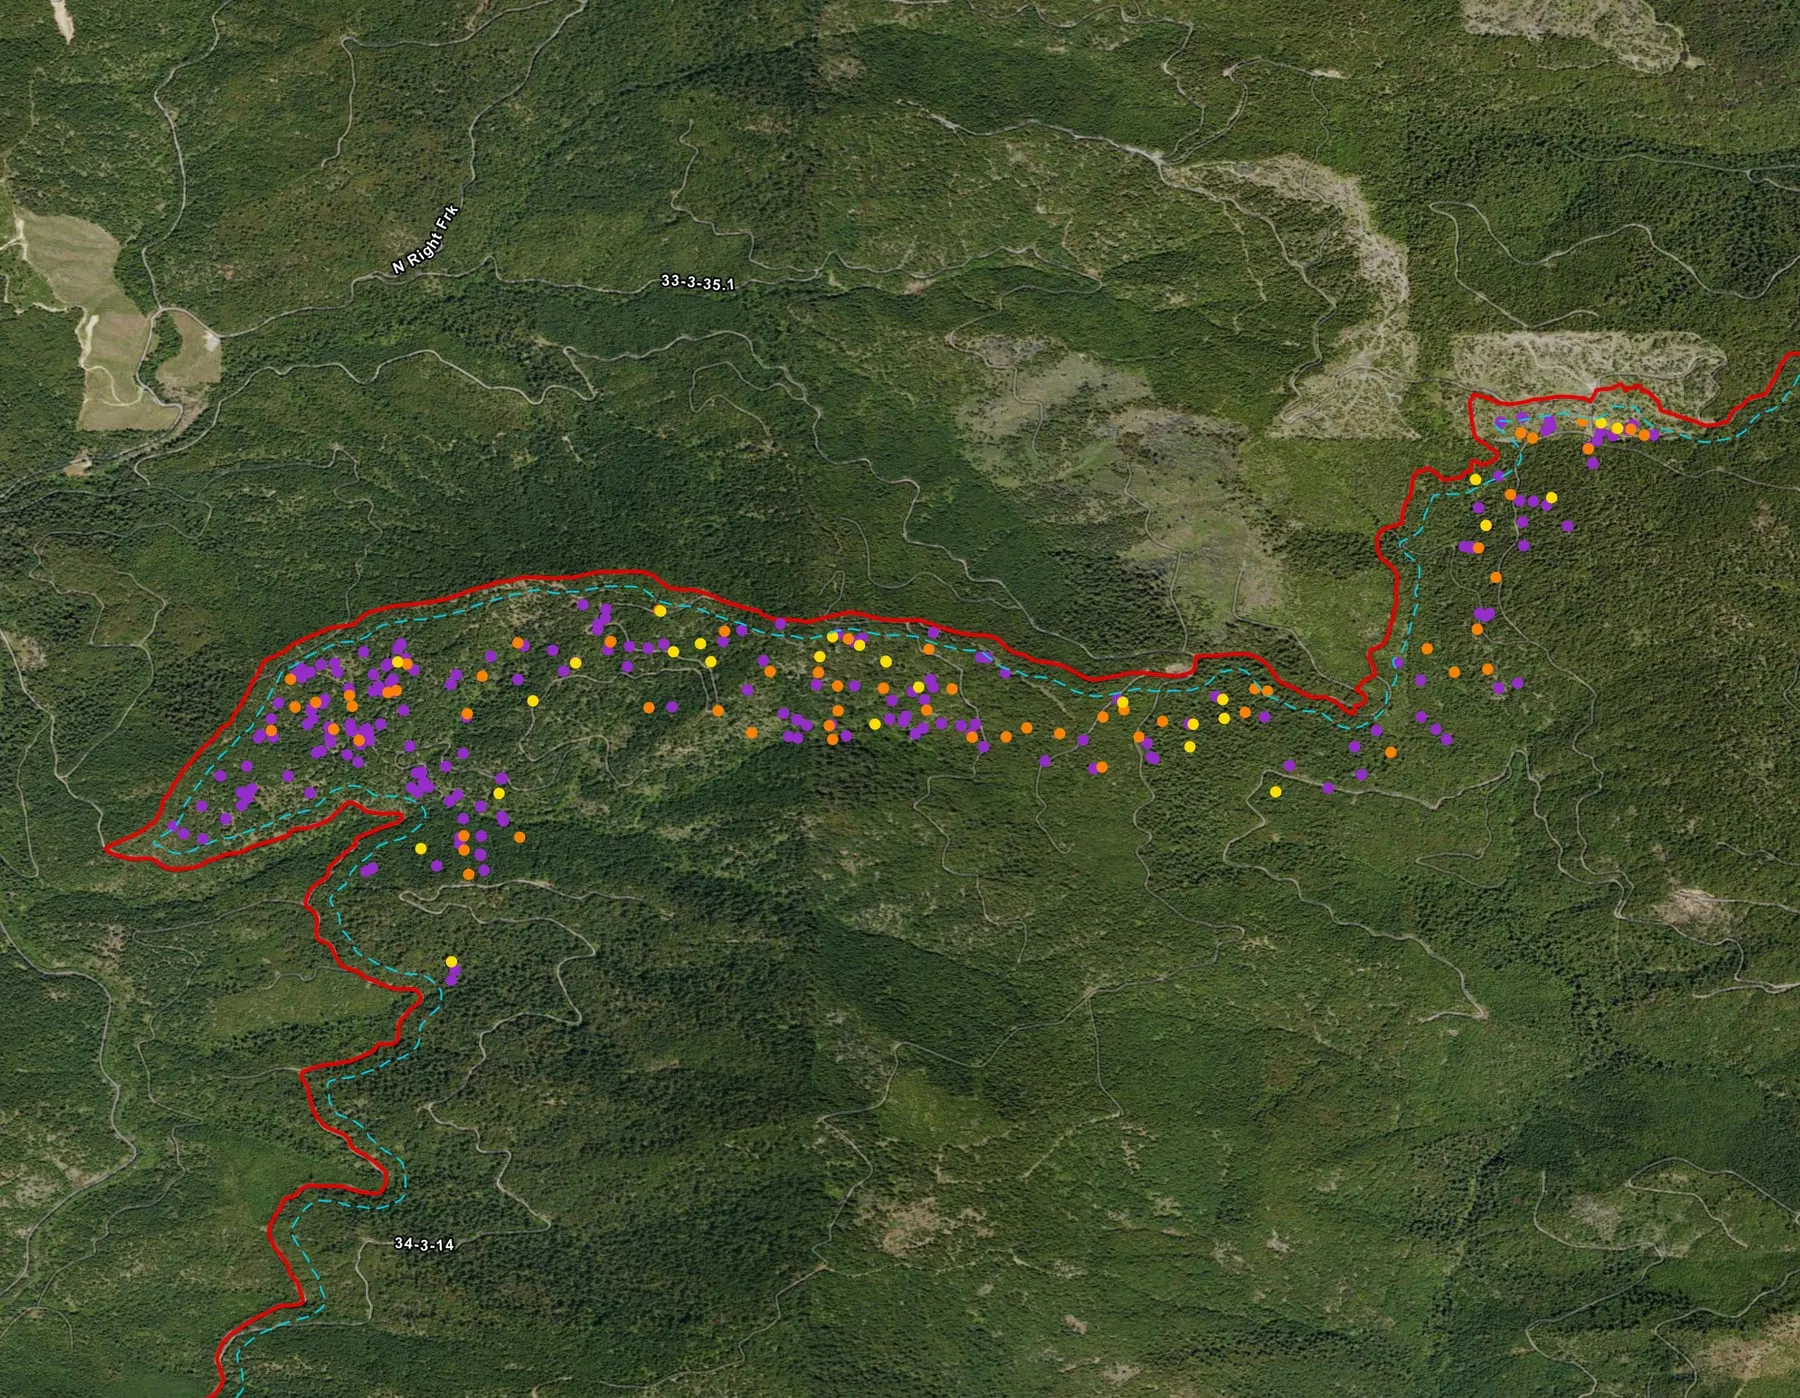
The fire where the 2026 season's first automated map sets were made, mapped division by division for three weeks by two organizations.
-
Brewer
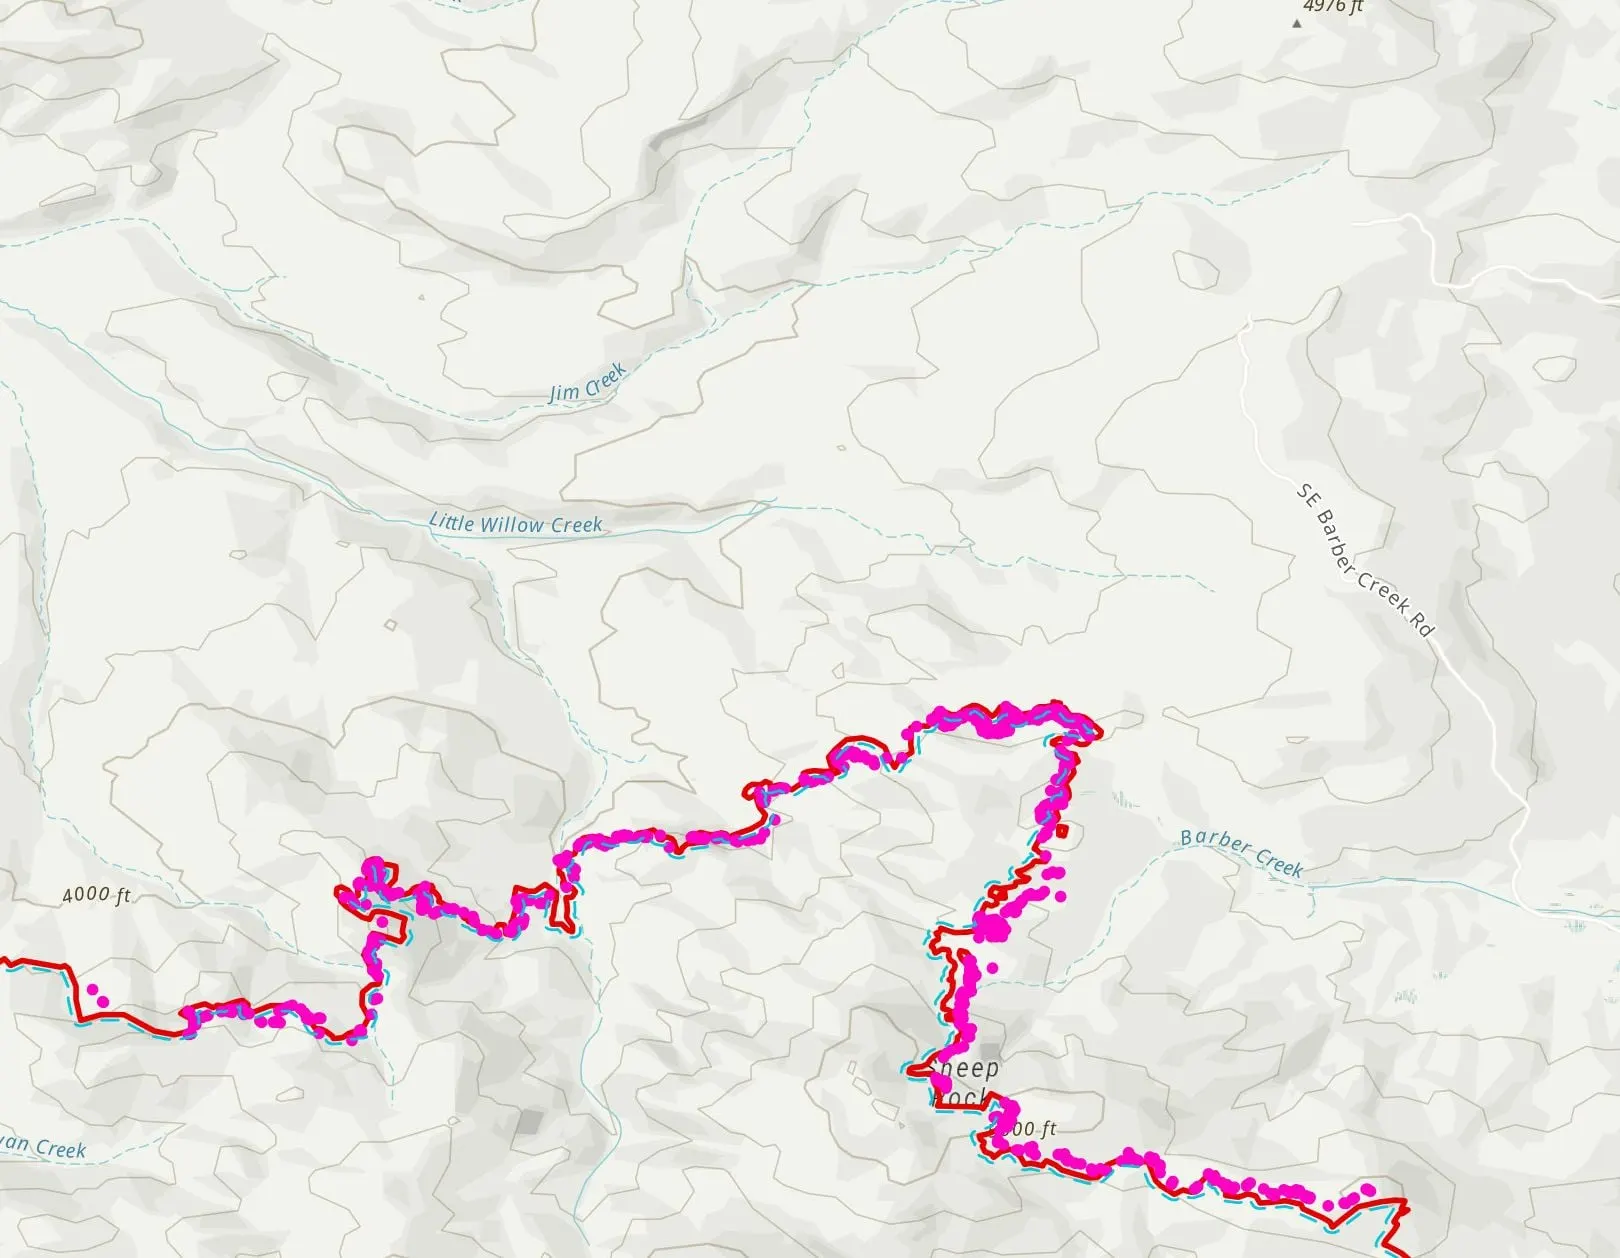
Drone heat along the daily fire perimeter, heat mapped outside it for spot fires, and a crewed aircraft's own flights turned into the same map set.
-
Rowe Creek Complex
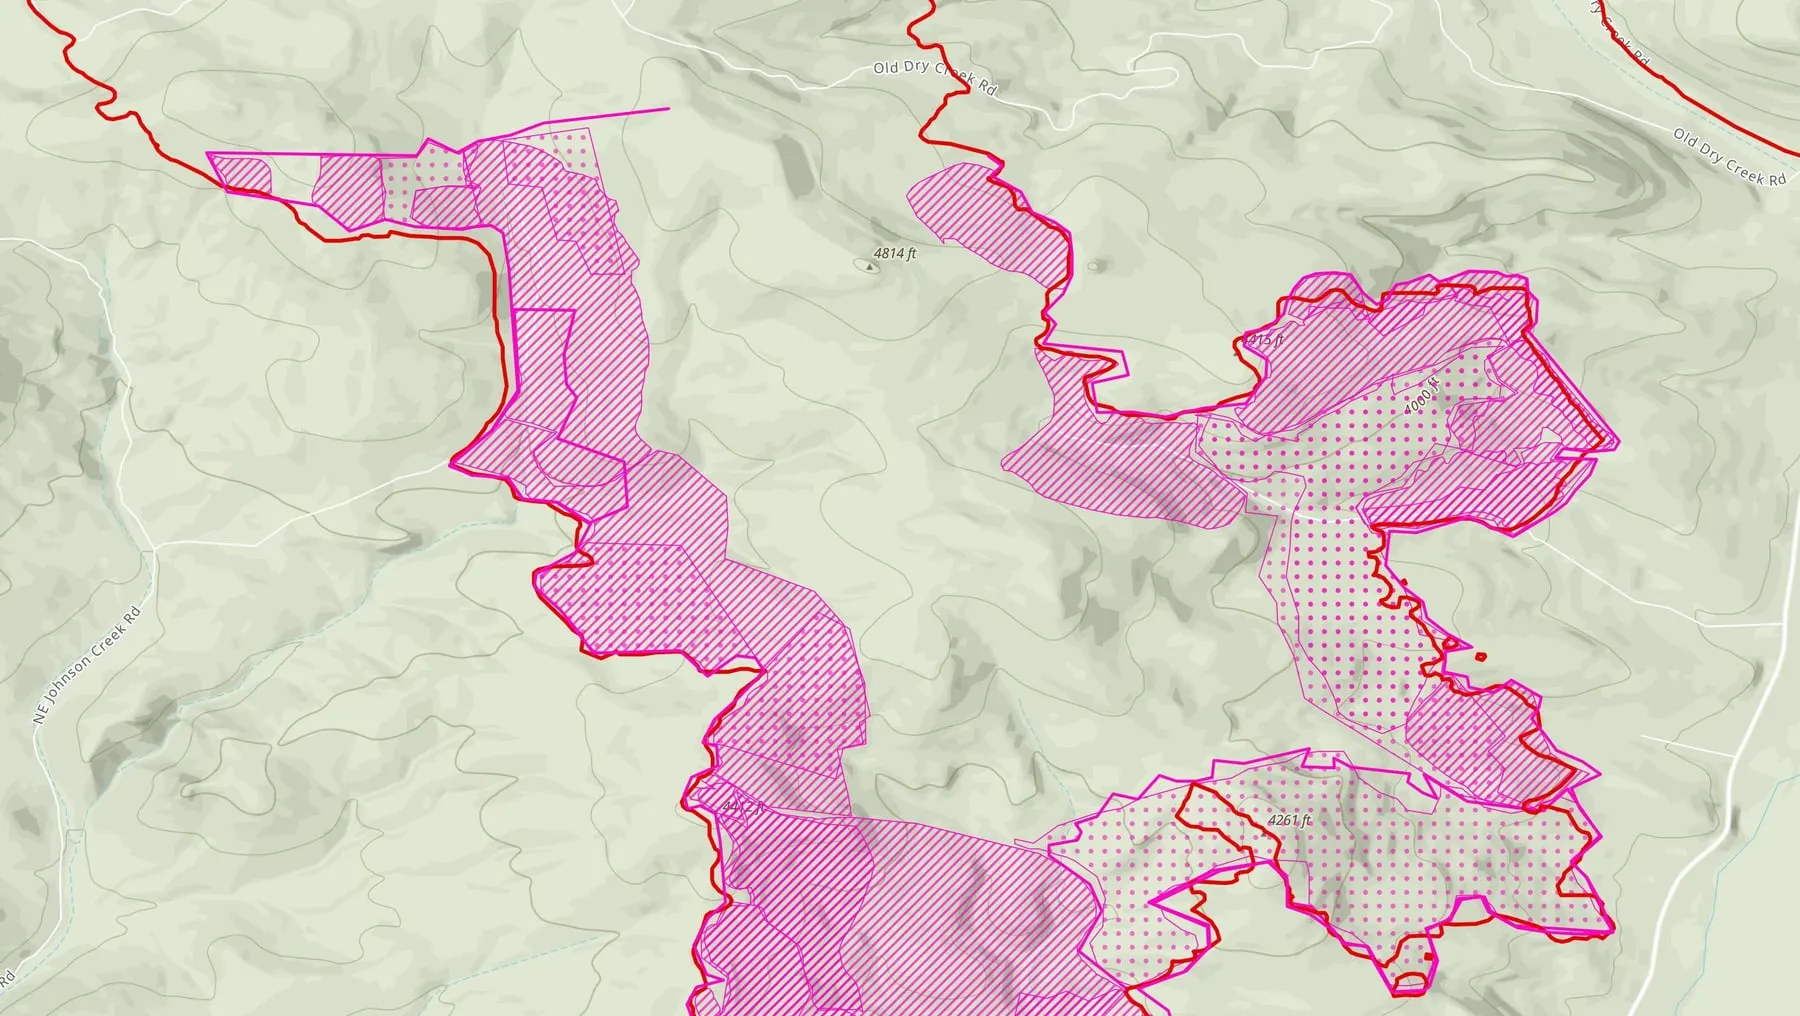
The largest fire in the archive this season, flown along the line by three organizations and two kinds of drone, from late July to the end of August.
Support the Collaborative
Every sheet on this page went to the incident.
A gift keeps the system running for the next fire, so the heat still in the ground reaches the incident on a sheet like these.